Application for Lecturer Presentation
- 1. Development of a framework for improvement of business processes in a service operation: An Action Research Approach
- 2. ŌĆó Introduction ŌĆó Literature Review ŌĆó Objective of the study ŌĆó Methodology ŌĆó Case Description and Analysis ŌĆó Findings of the Study
- 3. ŌĆó Increase in economic contribution of the service based industries (Machuca et al., 2007; Bamford and Forrester, 2010): ŌĆó Emphasis on improvements in these service businesses. ŌĆó Quality and standard of the final service provided depends on the business processes (Dale et al., 2007) : ŌĆó Improvements in these processes will lead to considerable improvements in customer end service provided. ŌĆó These, along with many other studies and practical experiences, emphasize on Business Process Improvement. 1. Bamford, D. R. and Forrester, P. L. (2010) Essential guide to operations management: concepts and case notes. 1st edn. Chichester :Wiley. 2. Dale, B.G., Iwaarden, J and Wiele, A. (2007) Managing Quality. 5th edn. Oxford, UK: Blackwell. 3. Machuca, J.A.D, Gonz├Īlez-Zamora, M.D and Aguilar-Escobar, V.G. (2007) ŌĆśService operations management researchŌĆÖ, Journal of Operations Management, 25, pp. 585-603.
- 4. ŌĆó Steps in Business Process Improvement: ŌĆó Understanding of the system ŌĆó Understanding the process in the first requirement for suggesting improvement (Slack, 2006) ŌĆó Paradiso (2003) ŌĆō Process Maps leads to improvements through identification of bottlenecks and redundant steps ŌĆó Making the system leaner ŌĆō through Value Stream (VSA) ŌĆó First popularized by Womack and Jones (2003) ŌĆó Mehta and Fargher (2005) - Aim of process improvement is to increase the ration of Value Adding Activities to Non-Value Adding Activities ŌĆó Abdullah and Rajgopal (2009) ŌĆō Gap in the use of VSMs and Lean in Service Sector. 1. Abdullah, F., Rajgopal, J. (2003) ŌĆśLean manufacturing in the process industryŌĆÖ, Proceedings of the IIE Research Conference, CD-ROM, Portland, OR, IIE, Norcross, GA. 2. Mehta, M. and Fargher, J. (2005) ŌĆśGoodwill mappingŌĆÖ, Industrial Engineer, September, pp. 34-9. 3. Slack, N. (2006) Operations and process management: principles and practice for strategic impact. 1st edn. Harlow. UK: Financial Times Prentice Hall. 4. Paradiso, J. (2003) ŌĆśThe essential processŌĆÖ, Industrial Engineer, 35(4), pp. 46-8. 5. Womack, J. P. and Jones, D.T. (2003) Lean thinking: banish waste and create wealth in your corporation. Revised and Updated edn. New York : Free Press.
- 5. ŌĆó Steps in Business Process Improvement: ŌĆó Process Simulation ŌĆó Pidd (2003) ŌĆō Simulation can be used effectively to: ŌĆó Increase process understanding ŌĆó Find out problems in the system and suggest improvements ŌĆó Justify quantitatively the improvement steps needed ŌĆó Banks et al. (2005) ŌĆō Simulation shows the changes in the process performances real-time ŌĆó Need for a framework: ŌĆó Hall and Johnson (2010) ŌĆō The existing frameworks lack in exact steps that needs to be taken. ŌĆó Zellnor (2011) ŌĆō Some frameworks suggest steps for improvements, but lack the means of feasibility test. 1. Banks, J., Carson, J.S., Nelson, B.L., Nicol, D.M. (2005) Discrete-Event System Simulation. 4th edn. Upper Saddle River, NJ : Prentice Hall. 2. Hall, J.M. and Johnson, M.E. (2010) ŌĆśWhen should a process be art, not science?ŌĆÖ, Harvard Business Review, 87(3), pp. 58- 65. 3. Pidd, M. (2003) Tools for thinking: modelling in management science. 2nd edn. Chichester : Wiley. 4. Zellnor, G (2011) ŌĆśA structured evaluation of business process improvement approachesŌĆÖ, Business Process Management Journal, 17(2), pp. 203 ŌĆō 237.
- 7. ŌĆó Action Research (Costello, 2003): ŌĆó Incorporates learning from practical experiences into development of academic contributions: ŌĆó Why Action Research? ŌĆó Is real-time and incorporates feedback from steps already taken (Coughlan and Coghlan, 2002). ŌĆó Appropriate when a series of actions are required (Coghlan and Brannick, 2010). ŌĆó Action Research vs. Case Study ŌĆó Case Study ŌĆō One time incorporation of the findings of a practical situation into academic research ŌĆó Action Research ŌĆō Cyclical process of learning from practical context and making changes to the context 1. Coughlan, P. and Coghlan, D. (2002) ŌĆśAction research for operations managementŌĆÖ, International Journal of Operations and Project Management, 22(2), pp. 220-240. 2. Coghlan D. and Brannick, T. (2010) Doing Action Research in your Own Organization. 3rd edn. London: Sage.
- 8. ŌĆó Security ID Centre ŌĆō Manchester Airport ŌĆó Managed by Manchester Airport Group ŌĆó Processes Applications for Security Passes ŌĆó Issues Security Passes for different areas of Airport ŌĆó Processes Applications of Companies for getting involved in the Pass scheme ŌĆó Manages existing companies in the scheme and outstanding Passes ŌĆó Objectives ŌĆó Create better understanding of the office processes. ŌĆó Finding out outstanding problems for the office processes. ŌĆó Suggest short term ŌĆśQuick WinsŌĆÖ to improve the process ŌĆó Look for the feasibility of long term strategic changes of the office operations
- 9. ŌĆó Most accessible data available: ŌĆó The guidelines and procedures for application of security passes and company registration (Input) ŌĆó Qualitative data ŌĆō mostly forms, handbooks and website instructions ŌĆó A log of rejected applications for passes with the record of missing data or mistake in the relevant section of the application that resulted in rejection (Output) ŌĆó Quantitative data ŌĆō a log count, with checkmarks of sections that are missing
- 10. ŌĆó Tools used: Benchmarking and Pareto Analysis ŌĆó Benchmarking areas: ŌĆó The pass application procedures of other internationally acclaimed and heavy traffic airports ŌĆó Standards set for improvement: ŌĆó Improve on: ŌĆó Provision of Booking Appointments Online. ŌĆó More detailed guidelines for the type of Pass required. ŌĆó Checklists of documents and information required. ŌĆó Pareto Procedure: ŌĆó Analysis of Monthly and then Quarterly counts for data available of year 2011 to March 2012 ŌĆó Outcome: ŌĆó Some sections were found to be troublesome ŌĆó Some sections were missing more often
- 11. ŌĆó ŌĆśKaizenŌĆÖ Workshops: ŌĆó Focus on process understanding and improvement, including the recommendation of the employees. ŌĆó Participants were asked to discuss and detail out the steps involved in each of the processes. ŌĆó They were also asked to provide input on problems of the individual stages and ways of improving them ŌĆó The outputs of the Kaizen workshops were used to develop As-Is Process Maps of the processes of the Security ID centre. ŌĆó After that Value Stream Analysis (VSA) was carried out to check for: ŌĆó Redundant Activities ŌĆó Non Value Adding Activities
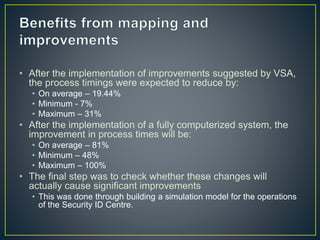
- 12. ŌĆó After the implementation of improvements suggested by VSA, the process timings were expected to reduce by: ŌĆó On average ŌĆō 19.44% ŌĆó Minimum - 7% ŌĆó Maximum ŌĆō 31% ŌĆó After the implementation of a fully computerized system, the improvement in process times will be: ŌĆó On average ŌĆō 81% ŌĆó Minimum ŌĆō 48% ŌĆó Maximum ŌĆō 100% ŌĆó The final step was to check whether these changes will actually cause significant improvements ŌĆó This was done through building a simulation model for the operations of the Security ID Centre.
- 13. ŌĆó Simulation model of the Security ID Centre was developed to: ŌĆó Reflect the present scenario, and create a better understanding of the processes ŌĆó Look into the state of the operations after the improvements suggested by VSA and automation are implemented ŌĆó Provide concrete means of deciding whether the changes suggested should be implemented or not.
- 14. ŌĆó Plotting of application input data over a period of 4 years to look for trend patterns: ŌĆó From the plot, it could be ssen that the data shows pattern wise variation ŌĆó As such, input data for the peak and trough seasons were taken for building two separate models. 0 50 100 150 200 250 1 55 109 163 217 271 325 379 433 487 541 595 649 703 757 811 865 919 973 1027 1081 1135 1189 1243 1297 1351 1405 1459 1513 1567 1621 1675 1729 1783
- 15. ŌĆó The data for the two seasons were then used to fit in statistical distributions: ŌĆó To incorporate stochasticity and randomness in the system ŌĆó To incorporate different uncertainties and possibilities in the real life model ŌĆó Statistical plots and tests were used to validate the choice of distributions: ŌĆó Chi-Square Tests ŌĆó Anderson Darling Tests ŌĆó P-P (Probability Plots) ŌĆó A similar methodology was used for the case of modelling processing times.
- 17. ŌĆó Steady state is required for accurate representation and accurate predictions. ŌĆó 50 trials were required to obtain stable output: ŌĆó 450 hours of warm time to generate stable results: 90 92 94 96 98 100 5 10 15 20 25 30 40 50 60 70 93 94 95 96 97 98 99 100 101 0 20 40 60 80 100 130 160 190 220 250 350 450
- 18. ŌĆó Black box validation ŌĆó Results from model statistically checked with results from real life scenario ŌĆó Chi-Square Goodness of Fit Test ŌĆó Null hypothesis (The datasets belong to the same population) could not be rejected, at significance = 0.01 ŌĆó White box validation ŌĆó Turing Test ŌĆō The Business Analyst was thoroughly briefed on the internal workings of the model ŌĆó Data seasonality validation ŌĆó Two seasons ŌĆō Busy and Free Period ŌĆó Difference of Means (T-tests) were carried out ŌĆó Alternate hypothesis (The mean of the datasets are statistically different from each other) could not be rejected, as significance = 0.01
- 19. ŌĆó Two Scenarios for Two Periods ŌĆó Busy/Peak Period ŌĆó After implementation of improvements by VSA ŌĆó After implementation of fully automated system ŌĆó Free/ Trough Period ŌĆó Same as Busy Period ŌĆó Focus on: ŌĆó The average resource (FTE) required for each scenario ŌĆó The average number of Applications processed out in a set time period ŌĆō 3 hours ŌĆó Results were statistically tested for their difference of means (T-tests)
- 20. ŌĆó Post VSA ŌĆó 84% of applications processed within time ŌĆó Further Automation ŌĆó 98% of applications processed within time ŌĆó For resource usage: ŌĆó Decision for the Security ID Centre: ŌĆó Implement changes suggested by VSA ŌĆó Do not go for further automation and computerization of the systems: ŌĆó Investments required for specialist software and design in costly ŌĆó The benefits do not far outweigh the costs Busy Period Free Period 9.78 6.986.91 5.59 4.14 3.45 Original Post VSA Post Automation
- 21. Inputs & Outputs Exploratory Improvement Tools 7 Management Tools Benchmarking Other simple tools Quality Function Deployment Use: Exploratory analysis Target: Identify what is wrong. Find out quick wins Suggest the direction of furtheranalysis. Pareto Analysis Process Mapping ŌĆō As Is Use: Process Understanding Target: Involvement of staff to increase understanding of the processes. Clearrepresentation of present scenario Use of Mapping Tools As-Is MappingKaizen Events Validation with existing system Process Mapping ŌĆō To Be Use: Process Improvement Target: Elimination of non- valueadding activities. Improvements in necessary activities. Computerization Optimization. As-Is Maps VSA improvements BPM Improvements To-Be Maps Simulation Modelling Use: Optimization and Validation. Target: Increaseunderstanding of processes. Find out further areas of improvement. Quantify the improvements to validatethe use of approaches. Collect Data for model creation Fitting necessary statisticaldistributions Creating model for present scenario Validate the model Experiment with the model Implement the improvements suggested Record results and interpret Decide on Final Improvement Strategy
- 22. ŌĆó Limitations: ŌĆó Time ŌĆó Access to more detailed data ŌĆó Testing the suggested framework in different contexts ŌĆó Further Directions of Research ŌĆó This framework can be further clarified into detailed steps of implementation ŌĆó Suggestion of testing out other different tools ŌĆó Putting this framework to use in other contexts and compare the results: ŌĆó Other contexts similar to application handling ŌĆó Other completely different contexts
- 23. Thank You for your patience


