際際滷

際際滷Share a Scribd company logo
Life conference and exhibition 2010
Steven Morrison and Alex McNeil


                                                         Application of Extreme
                                                           Value Theory to Risk
                                                             Capital Estimation
                                                                      7-9 November 2010
息 2010 The Actuarial Profession  www.actuaries.org.uk
Application of EVT to risk capital estimation:
Agenda

 Motivation
 Background theory
 VaR case study
 Summary
 Questions or comments?


息 2010 The Actuarial Profession  www.actuaries.org.uk
                                                         1
Application of extreme value theory to risk capital estimation
Steven Morrison and Alex McNeil


                                                           Motivation


息 2010 The Actuarial Profession  www.actuaries.org.uk
Motivation


 Measures of risk capital are based on the (extreme) tail of a distribution
    Value at Risk (VaR)
    Conditional Value at Risk (CVaR) / Expected Shortfall


 In particular, Solvency II SCR is defined as a 99.5% VaR over a one year
  horizon


 Generally needs to be estimated using simulation
   1. Generate real-world economic scenarios for all risk drivers affecting the
      balance sheet over one year
   2. Revalue the balance sheet under each real-world scenario
                          e.g. Monte Carlo (nested stochastic), Replicating Formula, Replicating Portfolio

            3. Estimate the statistics of interest
息 2010 The Actuarial Profession  www.actuaries.org.uk
                                                                                                               3
Motivation


 An insurer who has gone through such a simulation exercise states
    Our Solvency Capital Requirement is 贈77.5m


 How confident can we be in this number?


 Many sources of uncertainty
    Choice of economic scenario generator (ESG) models and their
     calibration
    Liability model assumptions e.g. dynamic lapse rules
    Choice of scenarios sampled i.e. choice of real-world ESG random
     number seed


息 2010 The Actuarial Profession  www.actuaries.org.uk
                                                                        4
Motivation


 The same insurer re-runs their internal model using a different random
  number seed (but all other assumptions are unchanged)
    Our Solvency Capital Requirement is now 贈82.8m


 So, simulation-based capital estimates are subject to statistical uncertainty
    Can we estimate this statistical uncertainty?
    How can we reduce the amount of statistical uncertainty?


 In this presentation, we will address these questions using a statistical
  technique known as Extreme Value Theory (EVT)


息 2010 The Actuarial Profession  www.actuaries.org.uk
                                                                                  5
Application of extreme value theory to risk capital estimation
Steven Morrison and Alex McNeil


                                                         Background theory


息 2010 The Actuarial Profession  www.actuaries.org.uk
Application of extreme value theory to risk capital estimation
Steven Morrison and Alex McNeil


                                                         VaR case study


息 2010 The Actuarial Profession  www.actuaries.org.uk
VaR Case study


Liability book
 UK-style with profits
    Management actions, dynamic EBR, dynamic bonus rates,
     regular premiums

Valuation methodology
 Nested stochastic
    1,000 real-world outer scenarios
    1,000 risk-neutral inner scenarios per outer scenario


息 2010 The Actuarial Profession  www.actuaries.org.uk
                                                             8
Estimated distribution of liability value at end of year
(empirical quantile method)

 Estimate empirical
quantiles by ranking
1,000 scenarios

 Estimated 99.5% VaR =
贈77.5m
(995th worst-case
scenario)

 Note that estimated
distribution is lumpy,
particularly as we go
further out in the tail


息 2010 The Actuarial Profession  www.actuaries.org.uk
                                                         9
Estimated distributions using different scenario sets
(empirical quantile method)

Initial set of 1,000 real-
world scenarios
 99.5% VaR = 贈77.5m


Second set of 1,000
real-world scenarios
 99.5% VaR = 贈82.8m


息 2010 The Actuarial Profession  www.actuaries.org.uk
                                                         10
What is the true VaR?


 Two different estimates for VaR
    贈77.5m
    贈82.8m
    Which is correct?

 Both use same (subjective) modelling assumptions
    Same economic scenario generator and calibration
    Same liability model assumptions e.g. dynamic lapse rules

 Difference is purely due to different random number streams
  used to generate the economic scenarios
息 2010 The Actuarial Profession  www.actuaries.org.uk
                                                                 11
Two important questions


1. Can we reduce the sensitivity of the estimate to the choice of
   random numbers?
    Run more scenarios
                          May not be feasible because of model run-time

             Find a better estimator than the empirical quantile

2. Given a particular estimate of the 99.5% VaR, can we estimate
   the uncertainty around this?


息 2010 The Actuarial Profession  www.actuaries.org.uk
                                                                           12
Application of Extreme Value Theory


 Recall that Extreme Value Theory tells us something about the
  shape of the distribution in the tail
    Distribution of liability value beyond some threshold is
     (approximately) Generalised Pareto
    Parameterised by 2 parameters

 Estimate the tail of the distribution by:
   1. Picking a threshold
   2. Fitting the 2 parameters of the Generalised Pareto
      Distribution to values in excess of the threshold

息 2010 The Actuarial Profession  www.actuaries.org.uk
                                                                  13
Choice of threshold

                                                                                   20
  Choice of threshold is subjective
     But examination of mean excess


                                                         Mean Excess (贈m)
                                                                                   15
      function helps identify a suitable
      choice                                                                       10


                                                                                   5
  We have judged that a threshold of                                                   20       40         60           80    100
                                                                                                       Threshold (贈m)
   贈40m is suitable for this particular                                             20
   case study


                                                                Mean Excess (贈m)
     Approximately 26% of scenarios                                                15

      exceed the threshold
                                                                                    10


                                                                                        5
                                                                                            20    40          60          80    100
                                                                                                        Threshold (贈m)

息 2010 The Actuarial Profession  www.actuaries.org.uk
                                                                                                                                14
Estimated distributions using different scenario sets
(Extreme Value Theory method)
Initial set of 1,000 real-world
scenarios
 99.5% VaR = 贈75.9m
 95% confidence interval =
[71.1m, 84.3m]


Second set of 1,000 real-
world scenarios
 99.5% VaR = 贈77.8m
 95% confidence interval =
[72.2m, 87.7m]


息 2010 The Actuarial Profession  www.actuaries.org.uk
                                                         15
Application of extreme value theory to risk capital estimation
Steven Morrison and Alex McNeil


                                                             Summary


息 2010 The Actuarial Profession  www.actuaries.org.uk
Summary


 Simulation-based measures of risk capital, e.g. VaR, are subject
  to statistical uncertainty


 Extreme Value Theory provides a robust method for estimating
  VaR
             Allows statistical uncertainty to be estimated
             Statistical uncertainty lower than na誰ve quantile estimation
             Provides an estimate of entire tail of distribution, allowing estimate of
              more extreme VaR, CVaR etc.


息 2010 The Actuarial Profession  www.actuaries.org.uk
                                                                                          17
Questions or comments?


Expressions of individual views by
members of The Actuarial Profession
and its staff are encouraged.
The views expressed in this presentation
are those of the presenter.


息 2010 The Actuarial Profession  www.actuaries.org.uk
                                                         18

More Related Content

Application of Extreme Value Theory to Risk Capital Estimation

  • 1. Life conference and exhibition 2010 Steven Morrison and Alex McNeil Application of Extreme Value Theory to Risk Capital Estimation 7-9 November 2010 息 2010 The Actuarial Profession www.actuaries.org.uk
  • 2. Application of EVT to risk capital estimation: Agenda Motivation Background theory VaR case study Summary Questions or comments? 息 2010 The Actuarial Profession www.actuaries.org.uk 1
  • 3. Application of extreme value theory to risk capital estimation Steven Morrison and Alex McNeil Motivation 息 2010 The Actuarial Profession www.actuaries.org.uk
  • 4. Motivation Measures of risk capital are based on the (extreme) tail of a distribution Value at Risk (VaR) Conditional Value at Risk (CVaR) / Expected Shortfall In particular, Solvency II SCR is defined as a 99.5% VaR over a one year horizon Generally needs to be estimated using simulation 1. Generate real-world economic scenarios for all risk drivers affecting the balance sheet over one year 2. Revalue the balance sheet under each real-world scenario e.g. Monte Carlo (nested stochastic), Replicating Formula, Replicating Portfolio 3. Estimate the statistics of interest 息 2010 The Actuarial Profession www.actuaries.org.uk 3
  • 5. Motivation An insurer who has gone through such a simulation exercise states Our Solvency Capital Requirement is 贈77.5m How confident can we be in this number? Many sources of uncertainty Choice of economic scenario generator (ESG) models and their calibration Liability model assumptions e.g. dynamic lapse rules Choice of scenarios sampled i.e. choice of real-world ESG random number seed 息 2010 The Actuarial Profession www.actuaries.org.uk 4
  • 6. Motivation The same insurer re-runs their internal model using a different random number seed (but all other assumptions are unchanged) Our Solvency Capital Requirement is now 贈82.8m So, simulation-based capital estimates are subject to statistical uncertainty Can we estimate this statistical uncertainty? How can we reduce the amount of statistical uncertainty? In this presentation, we will address these questions using a statistical technique known as Extreme Value Theory (EVT) 息 2010 The Actuarial Profession www.actuaries.org.uk 5
  • 7. Application of extreme value theory to risk capital estimation Steven Morrison and Alex McNeil Background theory 息 2010 The Actuarial Profession www.actuaries.org.uk
  • 8. Application of extreme value theory to risk capital estimation Steven Morrison and Alex McNeil VaR case study 息 2010 The Actuarial Profession www.actuaries.org.uk
  • 9. VaR Case study Liability book UK-style with profits Management actions, dynamic EBR, dynamic bonus rates, regular premiums Valuation methodology Nested stochastic 1,000 real-world outer scenarios 1,000 risk-neutral inner scenarios per outer scenario 息 2010 The Actuarial Profession www.actuaries.org.uk 8
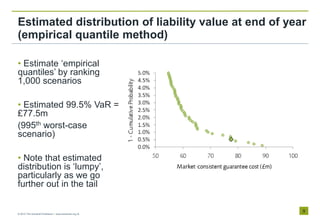
  • 10. Estimated distribution of liability value at end of year (empirical quantile method) Estimate empirical quantiles by ranking 1,000 scenarios Estimated 99.5% VaR = 贈77.5m (995th worst-case scenario) Note that estimated distribution is lumpy, particularly as we go further out in the tail 息 2010 The Actuarial Profession www.actuaries.org.uk 9
  • 11. Estimated distributions using different scenario sets (empirical quantile method) Initial set of 1,000 real- world scenarios 99.5% VaR = 贈77.5m Second set of 1,000 real-world scenarios 99.5% VaR = 贈82.8m 息 2010 The Actuarial Profession www.actuaries.org.uk 10
  • 12. What is the true VaR? Two different estimates for VaR 贈77.5m 贈82.8m Which is correct? Both use same (subjective) modelling assumptions Same economic scenario generator and calibration Same liability model assumptions e.g. dynamic lapse rules Difference is purely due to different random number streams used to generate the economic scenarios 息 2010 The Actuarial Profession www.actuaries.org.uk 11
  • 13. Two important questions 1. Can we reduce the sensitivity of the estimate to the choice of random numbers? Run more scenarios May not be feasible because of model run-time Find a better estimator than the empirical quantile 2. Given a particular estimate of the 99.5% VaR, can we estimate the uncertainty around this? 息 2010 The Actuarial Profession www.actuaries.org.uk 12
  • 14. Application of Extreme Value Theory Recall that Extreme Value Theory tells us something about the shape of the distribution in the tail Distribution of liability value beyond some threshold is (approximately) Generalised Pareto Parameterised by 2 parameters Estimate the tail of the distribution by: 1. Picking a threshold 2. Fitting the 2 parameters of the Generalised Pareto Distribution to values in excess of the threshold 息 2010 The Actuarial Profession www.actuaries.org.uk 13
  • 15. Choice of threshold 20 Choice of threshold is subjective But examination of mean excess Mean Excess (贈m) 15 function helps identify a suitable choice 10 5 We have judged that a threshold of 20 40 60 80 100 Threshold (贈m) 贈40m is suitable for this particular 20 case study Mean Excess (贈m) Approximately 26% of scenarios 15 exceed the threshold 10 5 20 40 60 80 100 Threshold (贈m) 息 2010 The Actuarial Profession www.actuaries.org.uk 14
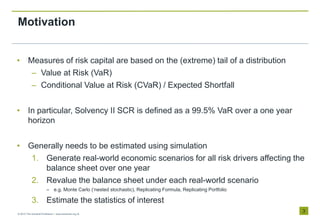
  • 16. Estimated distributions using different scenario sets (Extreme Value Theory method) Initial set of 1,000 real-world scenarios 99.5% VaR = 贈75.9m 95% confidence interval = [71.1m, 84.3m] Second set of 1,000 real- world scenarios 99.5% VaR = 贈77.8m 95% confidence interval = [72.2m, 87.7m] 息 2010 The Actuarial Profession www.actuaries.org.uk 15
  • 17. Application of extreme value theory to risk capital estimation Steven Morrison and Alex McNeil Summary 息 2010 The Actuarial Profession www.actuaries.org.uk
  • 18. Summary Simulation-based measures of risk capital, e.g. VaR, are subject to statistical uncertainty Extreme Value Theory provides a robust method for estimating VaR Allows statistical uncertainty to be estimated Statistical uncertainty lower than na誰ve quantile estimation Provides an estimate of entire tail of distribution, allowing estimate of more extreme VaR, CVaR etc. 息 2010 The Actuarial Profession www.actuaries.org.uk 17
  • 19. Questions or comments? Expressions of individual views by members of The Actuarial Profession and its staff are encouraged. The views expressed in this presentation are those of the presenter. 息 2010 The Actuarial Profession www.actuaries.org.uk 18