HPC Application Profiling and Analysis
- 1. Application Pro?ling & Analysis Rishi Pathak National PARAM Supercomputing Facility, C-DAC riship@cdac.in
- 2. What is application profiling ? Profiling ©C Recording of summary information during execution ? inclusive, exclusive time, # calls, hardware counter statistics, ĪŁ ©C Reflects performance behavior of program entities ? functions, loops, basic blocks ? user-defined Ī░semanticĪ▒ entities ©C Very good for low-cost performance assessment ©C Helps to expose performance bottlenecks and hotspots ©C Implemented through either ? sampling: periodic OS interrupts or hardware counter traps ? measurement: direct insertion of measurement code
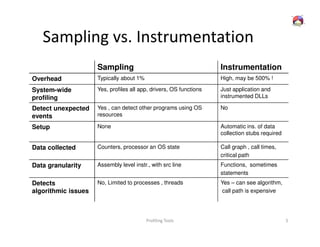
- 3. Sampling vs. Instrumentation Sampling Instrumentation Overhead Typically about 1% High, may be 500% ! System-wide Yes, profiles all app, drivers, OS functions Just application and profiling instrumented DLLs Detect unexpected Yes , can detect other programs using OS No events resources Setup None Automatic ins. of data collection stubs required Data collected Counters, processor an OS state Call graph , call times, critical path Data granularity Assembly level instr., with src line Functions, sometimes statements Detects No, Limited to processes , threads Yes ©C can see algorithm, algorithmic issues call path is expensive Profiling Tools 3
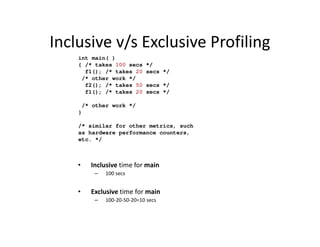
- 4. Inclusive v/s Exclusive Profiling int main( ) { /* takes 100 secs */ f1(); /* takes 20 secs */ /* other work */ f2(); /* takes 50 secs */ f1(); /* takes 20 secs */ /* other work */ } /* similar for other metrics, such as hardware performance counters, etc. */ ? Inclusive time for main ©C 100 secs ? Exclusive time for main ©C 100-20-50-20=10 secs
- 5. What are Application Traces ? Tracing ©C Recording of information about significant points (events) during program execution ? entering/exiting code region (function, loop, block, ĪŁ) ? thread/process interactions (e.g., send/receive message) ©C Save information in event record ? timestamp ? CPU identifier, thread identifier ? Event type and event-specific information ©C Event trace is a time-sequenced stream of event records ©C Can be used to reconstruct dynamic program behavior ©C Typically requires code instrumentation
- 6. Profiling v/s Tracing ? Profiling ©C Summary statistics of performance metrics ? Number of times a routine was invoked ? Exclusive, inclusive time/hpm counts spent executing it ? Number of instrumented child routines invoked, etc. ? Structure of invocations (call-trees/call-graphs) ? Memory, message communication sizes ? Tracing ©C When and where events took place along a global timeline ? Time-stamped log of events ? Message communication events (sends/receives) are tracked ? Shows when and from/to where messages were sent ? Large volume of performance data generated usually leads to more perturbation in the program
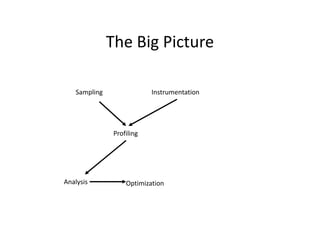
- 7. The Big Picture Sampling Instrumentation Profiling Analysis Optimization
- 9. Measurements - Instrumentation Instrumentation - Adding measurement probes to the code to observe its execution ©C Can be done on several levels ©C Different techniques for different levels ©C Different overheads and levels of accuracy with each technique ©C No instrumentation: run in a simulator. E.g., Valgrind
- 10. Measurements - Instrumentation ? Source code instrumentation ©C User added time measurement, etc. (e.g., printf(), gettimeofday()) Measurements - Instrumentation ©C Many tools expose mechanisms for source code instrumentation in addition to automatic instrumentation facilities they offer ©C Instrument program phases: ? initialization/main iteration loop/data post processing
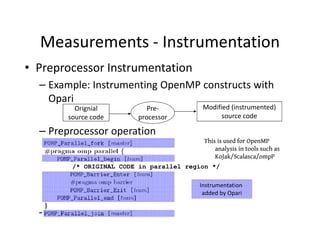
- 11. Measurements - Instrumentation ? Preprocessor Instrumentation ©C Example: Instrumenting OpenMP constructs with Opari Orignial Pre- Modified (instrumented) source code processor source code ©C Preprocessor operation This is used for OpenMP analysis in tools such as KoJak/Scalasca/ompP /* ORIGINAL CODE in parallel region */ Instrumentation added by Opari ©C Example: Instrumenta
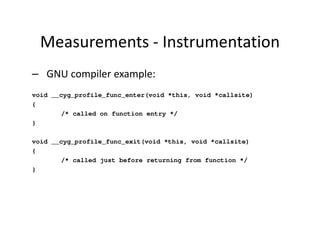
- 12. Measurements - Instrumentation ? Compiler Instrumentation ©C Many compilers can instrument functions automatically ©C GNU compiler flag: -finstrument- functions ©C Automatically calls functions on function entry/exit that a tool can capture ©C Not standardized across compilers, often undocumented flags, sometimes not available at all
- 13. Measurements - Instrumentation ©C GNU compiler example: void __cyg_profile_func_enter(void *this, void *callsite) { /* called on function entry */ } void __cyg_profile_func_exit(void *this, void *callsite) { /* called just before returning from function */ }
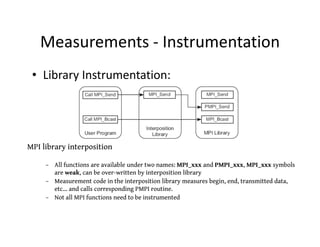
- 14. Measurements - Instrumentation ? Library Instrumentation: MPI library interposition ©C All functions are available under two names: MPI_xxx and PMPI_xxx, MPI_xxx symbols are weak, can be over-written by interposition library ©C Measurement code in the interposition library measures begin, end, transmitted data, etcĪŁ and calls corresponding PMPI routine. ©C Not all MPI functions need to be instrumented
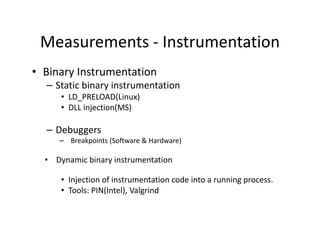
- 15. Measurements - Instrumentation ? Binary Instrumentation ©C Static binary instrumentation ? LD_PRELOAD(Linux) ? DLL injection(MS) ©C Debuggers ©C Breakpoints (Software & Hardware) ? Dynamic binary instrumentation ? Injection of instrumentation code into a running process. ? Tools: PIN(Intel), Valgrind
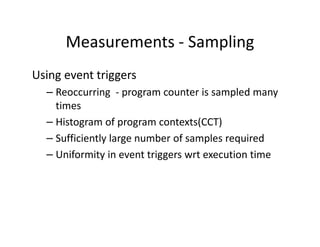
- 16. Measurements - Sampling Using event triggers ©C Reoccurring - program counter is sampled many times ©C Histogram of program contexts(CCT) ©C Sufficiently large number of samples required ©C Uniformity in event triggers wrt execution time
- 17. Measurements - Sampling Event trigger types ? Synchronous ©C Initiated by direct program action ©C E.g. memory allocation, I/O, and inter-process communication(including MPI communication) ? Asynchronous ©C Not initiated by direct program action ©C OS timer interrupt or ©C Hardware performance counter events ©C E.g. CPU, floating point instructions, clock cycles etc.
- 18. Profiling Tools ? Gprof ? Intel VTune ? Scalasca ? HPC Tool Kit Profiling Tools 18
- 19. HPC Tool Kit ? Name: HPCToolkit ? Developer: Rice University ? Website: ©C http://hpctoolkit.org 19
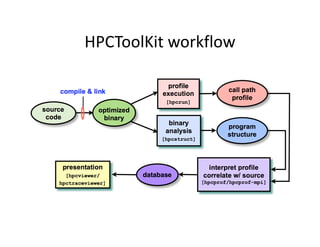
- 20. HPCToolkit Overview ? Consists of ©C hpcviewer ? Sorts by any collected metric, from any processes displayed ? Displays samples at various levels in call hierarchy through Ī░flatteningĪ▒ ? Allows user to focus in on interesting sections of the program through Ī░zoomingĪ▒ ©C Hpcprof and hpcprof-mpi ? Correlating dynamic profiles with static source code structure ©C hpcrun ? Application profiling using statistical sampling ? Hpcrun-flat ©C for collection of `flat' profile ©C Hpcstruct ? Recovers static program structure such as procedures and loop nests ©C Hpctraceviewer ©C Hpclink ? For statically-linked executables (e.g. for Cray XT or BG/P) 20
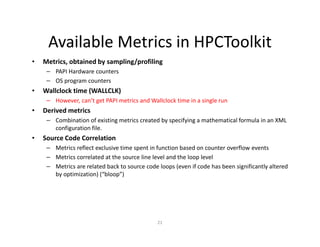
- 21. Available Metrics in HPCToolkit ? Metrics, obtained by sampling/profiling ©C PAPI Hardware counters ©C OS program counters ? Wallclock time (WALLCLK) ©C However, canĪ»t get PAPI metrics and Wallclock time in a single run ? Derived metrics ©C Combination of existing metrics created by specifying a mathematical formula in an XML configuration file. ? Source Code Correlation ©C Metrics reflect exclusive time spent in function based on counter overflow events ©C Metrics correlated at the source line level and the loop level ©C Metrics are related back to source code loops (even if code has been significantly altered by optimization) (Ī░bloopĪ▒) 21
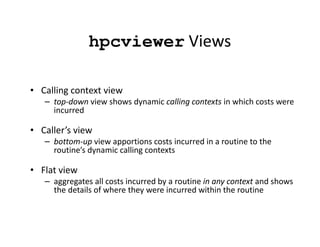
- 23. hpcviewer Views ? Calling context view ©C top-down view shows dynamic calling contexts in which costs were incurred ? CallerĪ»s view ©C bottom-up view apportions costs incurred in a routine to the routineĪ»s dynamic calling contexts ? Flat view ©C aggregates all costs incurred by a routine in any context and shows the details of where they were incurred within the routine
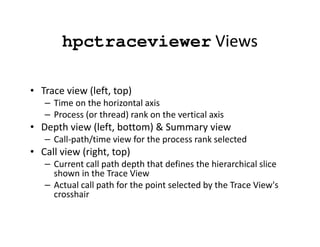
- 25. hpctraceviewer Views ? Trace view (left, top) ©C Time on the horizontal axis ©C Process (or thread) rank on the vertical axis ? Depth view (left, bottom) & Summary view ©C Call-path/time view for the process rank selected ? Call view (right, top) ©C Current call path depth that defines the hierarchical slice shown in the Trace View ©C Actual call path for the point selected by the Trace View's crosshair
- 26. Hpctraceviewer user interface - DEMO
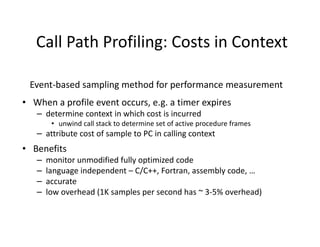
- 27. Call Path Profiling: Costs in Context Event-based sampling method for performance measurement ? When a profile event occurs, e.g. a timer expires ©C determine context in which cost is incurred ? unwind call stack to determine set of active procedure frames ©C attribute cost of sample to PC in calling context ? Benefits ©C monitor unmodified fully optimized code ©C language independent ©C C/C++, Fortran, assembly code, ĪŁ ©C accurate ©C low overhead (1K samples per second has ~ 3-5% overhead)
- 28. Demo for : ? Hpcrun (list events & proifiling) ? Hpcstruct ? hpcprof
- 29. PAPI ? Performance Application Programming Interface ©C The purpose of the PAPI project is to design, standardize and implement a portable and efficient API to access the hardware performance monitor counters found on most modern microprocessors. ? Parallel Tools Consortium project started in 1998 ? Developed by University of Tennessee, Knoxville ? http://icl.cs.utk.edu/papi/
- 30. PAPI - Support ? Unix/Linux ©C Perfctr kernel patch for kernel < 2.6.30 ©C Perf package for kernel >= 2.6.30
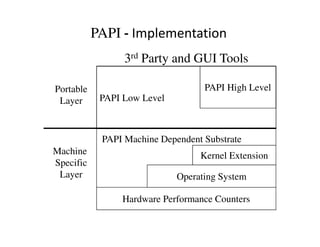
- 31. PAPI - Implementation 3rd Party and GUI Tools Portable PAPI High Level Layer PAPI Low Level PAPI Machine Dependent Substrate Machine Kernel Extension Specific Layer Operating System Hardware Performance Counters
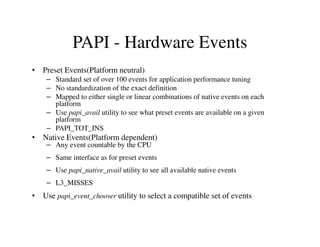
- 32. PAPI - Hardware Events ? Preset Events(Platform neutral) ©C Standard set of over 100 events for application performance tuning ©C No standardization of the exact definition ©C Mapped to either single or linear combinations of native events on each platform ©C Use papi_avail utility to see what preset events are available on a given platform ©C PAPI_TOT_INS ? Native Events(Platform dependent) ©C Any event countable by the CPU ©C Same interface as for preset events ©C Use papi_native_avail utility to see all available native events ©C L3_MISSES ? Use papi_event_chooser utility to select a compatible set of events
- 33. PAPI events demo papi_avail papi_native_avail papi_event_chooser Availability for QPI h/w performance counters using /sbin/lspci
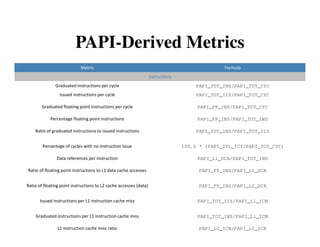
- 34. PAPI-Derived Metrics Metric Formula Instructions Graduated instructions per cycle PAPI_TOT_INS/PAPI_TOT_CYC Issued instructions per cycle PAPI_TOT_IIS/PAPI_TOT_CYC Graduated floating point instructions per cycle PAPI_FP_INS/PAPI_TOT_CYC Percentage floating point instructions PAPI_FP_INS/PAPI_TOT_INS Ratio of graduated instructions to issued instructions PAPI_TOT_INS/PAPI_TOT_IIS Percentage of cycles with no instruction issue 100.0 * (PAPI_STL_ICY/PAPI_TOT_CYC) Data references per instruction PAPI_L1_DCA/PAPI_TOT_INS Ratio of floating point instructions to L1 data cache accesses PAPI_FP_INS/PAPI_L1_DCA Ratio of floating point instructions to L2 cache accesses (data) PAPI_FP_INS/PAPI_L2_DCA Issued instructions per L1 instruction cache miss PAPI_TOT_IIS/PAPI_L1_ICM Graduated instructions per L1 instruction cache miss PAPI_TOT_INS/PAPI_L1_ICM L1 instruction cache miss ratio PAPI_L2_ICR/PAPI_L1_ICR
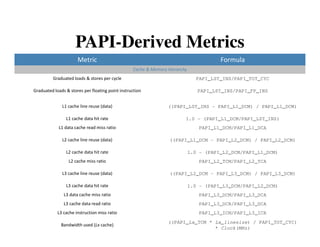
- 35. PAPI-Derived Metrics Metric Formula Cache & Memory Hierarchy Graduated loads & stores per cycle PAPI_LST_INS/PAPI_TOT_CYC Graduated loads & stores per floating point instruction PAPI_LST_INS/PAPI_FP_INS L1 cache line reuse (data) ((PAPI_LST_INS - PAPI_L1_DCM) / PAPI_L1_DCM) L1 cache data hit rate 1.0 - (PAPI_L1_DCM/PAPI_LST_INS) L1 data cache read miss ratio PAPI_L1_DCM/PAPI_L1_DCA L2 cache line reuse (data) ((PAPI_L1_DCM - PAPI_L2_DCM) / PAPI_L2_DCM) L2 cache data hit rate 1.0 - (PAPI_L2_DCM/PAPI_L1_DCM) L2 cache miss ratio PAPI_L2_TCM/PAPI_L2_TCA L3 cache line reuse (data) ((PAPI_L2_DCM - PAPI_L3_DCM) / PAPI_L3_DCM) L3 cache data hit rate 1.0 - (PAPI_L3_DCM/PAPI_L2_DCM) L3 data cache miss ratio PAPI_L3_DCM/PAPI_L3_DCA L3 cache data read ratio PAPI_L3_DCR/PAPI_L3_DCA L3 cache instruction miss ratio PAPI_L3_ICM/PAPI_L3_ICR ((PAPI_Lx_TCM * Lx_linesize) / PAPI_TOT_CYC) Bandwidth used (Lx cache) * Clock(MHz)
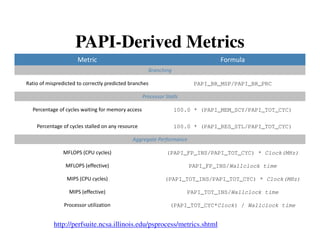
- 36. PAPI-Derived Metrics Metric Formula Branching Ratio of mispredicted to correctly predicted branches PAPI_BR_MSP/PAPI_BR_PRC Processor Stalls Percentage of cycles waiting for memory access 100.0 * (PAPI_MEM_SCY/PAPI_TOT_CYC) Percentage of cycles stalled on any resource 100.0 * (PAPI_RES_STL/PAPI_TOT_CYC) Aggregate Performance MFLOPS (CPU cycles) (PAPI_FP_INS/PAPI_TOT_CYC) * Clock(MHz) MFLOPS (effective) PAPI_FP_INS/Wallclock time MIPS (CPU cycles) (PAPI_TOT_INS/PAPI_TOT_CYC) * Clock(MHz) MIPS (effective) PAPI_TOT_INS/Wallclock time Processor utilization (PAPI_TOT_CYC*Clock) / Wallclock time http://perfsuite.ncsa.illinois.edu/psprocess/metrics.shtml
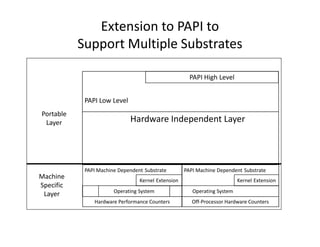
- 37. Component PAPI (PAPI-C) ? Goals: ©C Support for simultaneous access to on- and off-processor counters ©C Isolation of hardware dependent code in a separable Ī«substrateĪ» module ©C Extension of platform independent code to support multiple simultaneous substrates ©C API calls to support access to any of several substrates ? Released in PAPI 4.0
- 38. Extension to PAPI to Support Multiple Substrates PAPI High Level PAPI Low Level Portable Layer Hardware Independent Layer PAPI Machine Dependent Substrate PAPI Machine Dependent Substrate Machine Kernel Extension Kernel Extension Specific Operating System Operating System Layer Hardware Performance Counters Off-Processor Hardware Counters
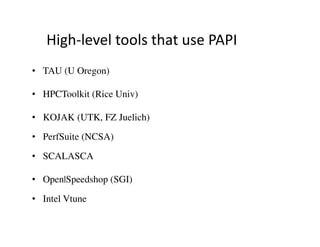
- 39. High-level tools that use PAPI ? TAU (U Oregon) ? HPCToolkit (Rice Univ) ? KOJAK (UTK, FZ Juelich) ? PerfSuite (NCSA) ? SCALASCA ? Open|Speedshop (SGI) ? Intel Vtune
- 40. ? Hpcviewer demo (trace, flops and clock cycles) ©C Nek5000(CFD solver using spectral element method) ©C Xhpl(Linpack)

