


More Related Content
Similar to Ascilite2010 (20)
Ascilite2010
- 1. Enabling comparisons of LMS usage across institutions, platforms and timehttp://indicatorsproject.wordpress.comindicatorsproject@gmail.com
- 5. What is the Indicators project?http://farm4.static.flickr.com/3182/2949435839_a53d509915.jpg
- 6. The Indicators is a research project aims to build on and extend prior work in the analysis of usage data from Learning Management Systems(Beer,Jones & Clark 2009)http://farm3.static.flickr.com/2248/2253657555_9306374c9f.jpg
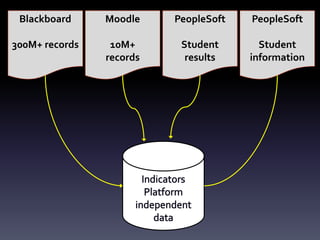
- 7. Blackboard300M+ recordsMoodle10M+recordsPeopleSoftStudent resultsPeopleSoftStudent informationIndicatorsPlatform independent data
- 18. n
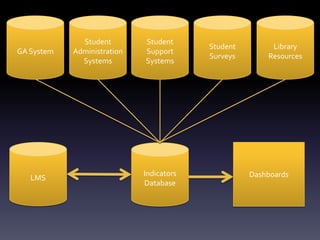
- 20. Student SurveysStudent AdministrationSystemsLibrary ResourcesStudent Support SystemsGA SystemLMSDashboardsIndicators Database
Editor's Notes
- #2: G’dayMy name is colin beer.This presentation is a very brief overview of what the indicators project team has been up to for the last twelve months since we last presented at ASCILITE around our dabblings into academic analytics. I’ll skim through this pretty quickly as I’d like to hear what you have to say about what we are doing.Is anyone not familiar with the term academic analytics?Academic analytics is the term that describes business intelligence in an academic setting. For us at CQUniversity, we are looking at ways by which we can harness the available data sources to inform and improve learning and teaching.
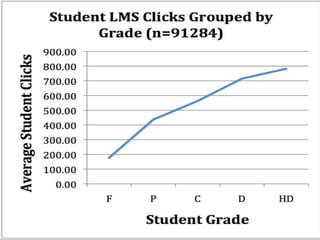
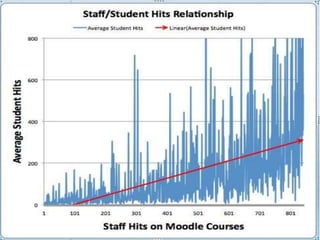
- #3: Basically the paper we submitted to ASCILITE this year was about showing that there is a link between student engagement and the amount of measureable activity students demonstrate within the learning management system. It a gross over simplification of the complexity of student engagement to say that student clicks on the LMS equals student engagement but we can show that there is a relationship between the quantity of student clicks within the LMS and their resulting grade. We also know that quantity does not necessarily equate to quality, although quantity has often been used as an indicator or student engagement in the past.
- #4: Douglas and Alemanne in 2007 suggested that most of the research into the measurement of student engagement prior to the widespread adoption of online classes concentrated on the simple measure of class attendance and there are obvious flaws in using class attendance as a metric for student engagement.
- #5: Fortunately learning management system logs provide us with a far more granular view of how students are interacting within the online environment.
- #7: BASICALLY WE ARE LOOKING TO BUILD ON EXISTING RESEARCH AROUND THE ANALYSIS OF USAGE DATA FROM LEARNING MANAGEMENT SYSTEMS SUCH AS MOODLE.MOST LEARNING MANAGEMENT SYSTEMS (AND MOODLE IS NO EXCEPTION) RECORD THE LOCATION OF EVERY STAFF AND STUDENT CLICK WITHIN THE SYSTEM.
- #8: Essentially we have taken the activity logs from our previous LMS that was Blackboard, the activity logs from our current LMS which is Moodle and combined them with results and demographic data from our stduent administration which is people soft.We have created a nightly refreshed database that aggregates the data from these other systems based on courses and students.To give you an idea as to the scale of the data sets we are talking about, there was over 300 million clicks or hits extracted from Blackboard and there is currently around 10-15 millions clicks in our Moodle database.To date we are focusing on online students as their activity data within the LMS is less likely to have been influenced by factors external to the LMS such as face-to-face instruction.
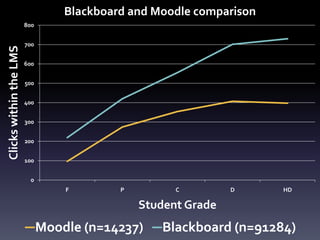
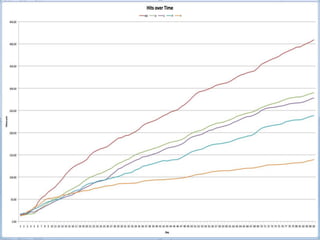
- #10: The same trend is still apparent on Moodle although students don’t make as many clicks on Moodle as they did on Blackboard.Moodle has a much flatter interface whereas Blackboard 6.3 had a hierarchical interface which meant that the students had to make more clicks within the system on average. Its important to note that while Blackboard required more clicks, Moodle requires more scrolling and the argument about which one is worse or better will likely go on longer than I will.
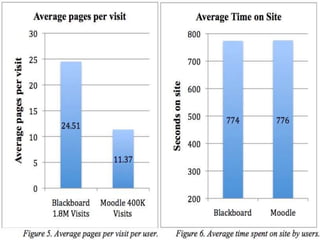
- #11: This is taken from the web server logs from Blackboard and Moodle and tends to reinforce.As an example of the interesting correlations we have been producing.
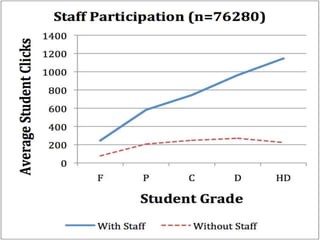
- #13: This chart also hints at the influence that instructor engagement in online courses has.These sorts of correlations are all well and good and provide plenty of opportunity for future research, but we wanted to see if we can draw on the data collected by the indicators project to help with a problem our institution is trying to solve.
- #14: At CQUniversity we have a particular problem we are trying to solve with regards to high rates of attrition with our flex or online student cohort.
- #15: The learning interactions of online of students is typically facilitated by the learning management system. So given the database that we have established, we wanted to see if we could use this data to help with our specific problem relating to online student attrition
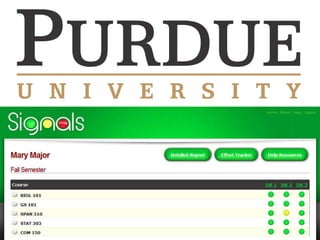
- #17: Signals was piloted in the 2006-07 and 2007-08 academic years. According to Purdue, the pilot involved nearly 2,000 students, where a double-blind study found that 67 percent of students receiving a yellow or red warning improved their effort and grade. For students who received a red light only, 78 percent improved their grade and effort during the mid-term period (Purdue University, 2009).Signals combines “predictive modeling” with data-mining from Blackboard Vista, Purdue University’s course management system. When an instructor runs a Signals intervention, each student is assigned to a “risk group”, denoted by one of three stoplight ratings -- corresponding to green (not at-risk), yellow (may be at-risk) or red (at-risk) stoplight icons – which are released to the student’s Blackboard course page.When students see the stoplight icon, they get an immediate, clear and effective message, with accompanying information on what the rating means and what they may do to improve their performance.
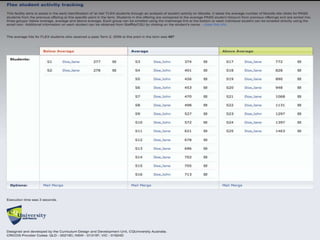
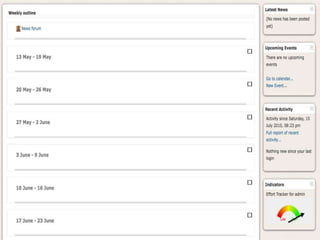
- #18: This is a website that we have created to try and tap into the predictive potential of LMS activity logs.Basically we look at previous offerings of an online course and look at passing students at this point in the term. We look at the number of clicks they made on content, activities and resources along with the number of forum posts, replies and reads, and munge this together so that the current cohort of students can be compared with passing students from previous course offerings.It then sorts these students into three groups, below average, average and above average and provides the instructor with a mail merge facility so that they can compliment the above average students, prompt the average and below average students. This is based on research that suggests that early intervention is a key strategy when trying to address student attrition.We trialed this with a dozen courses in term 2 this year and are currently trying to find the time to analyse the results. Although early feedback from instructors with large numbers of online students has been very positive.
- #20: We are also looking at producing a dashboard for teaching staff. CQUniversity currently has an excellent dashboard system produced by the business intelligence unit that shows things like enrolement trends, failure rates and attrition. This is all very valuable strategic data. However we believe that there is a gap when it comes to tactical data designed to assist the instructor at the point of need.
- #21: We are going to be linking the indicators database with a range of other data sources from around the university such as library resources, student surveys and student support systems.Essentially we are trying to extract as much information as we can out of existing university systems and deliver it to the point of need, which in most cases is the course coordinator.
- #22: One of the areas I’m particularly interested in is the ethics around the monitoring of student behaviors within online environments and the apparent mismatch between what is being done in online environments and what is acceptable in offline environments.