際際滷

際際滷Share a Scribd company logo
Effects of Asthma Drug on Pulmonary function
Introduction
The main aim of this project is to assess the effectiveness as well as the adverse effects of
a new asthma drug on pulmonary function. This pulmonary function is assessed using the
Forced Vital Capacity (FVC) parameter. The data that we have is a trial that was a
randomized, double-blind, placebo-controlled trial. The participants were assessed at
baseline and after 4 weeks. The primary outcome of interest is the FVC at week 4, i.e. 4
weeks after the drug has been taken. The secondary outcome is the proportion of
participants who experienced an asthma attack during the trial period.
Dataset Description
Total number of rows = 150
id: ID numbers for each participant. There are 150 participants in total.
age: Age of the participants. Two (id = 5, 87) participants did not disclose their age.
sex: 1 = Male, 2 = Female
sev: 1 = Mild, 2 = Moderate, 3 = Severe
fvcB: Forced vital capacity (FVC) measured at baseline. FVC is the amount of air exhaled
forcefully and quickly after inhaling as much as you can, and it is measured in litres (L).
fvcF: FVC measured at follow-up (week 4) in litres (L).
attack: An indicator variable to indicate whether or not participants experienced a
severe asthma
attack during the 4-week trial, 0 = no asthma attack, 1 = severe asthma attack.
trt: 0 = placebo inhaler, 1 = active inhaler
Methods
As we observe, the dataset has one Dependent Variable (column trt) with two levels of
independent variables (0 = placebo inhaler, 1 = active inhaler). The nature of the FVC
values being normal I have used the 2 independent sample t-test to study the difference
between the placebo inhaler and the active inhaler. To compare the side-effects of the
drug I have used probabilities and Chi-squared tests.
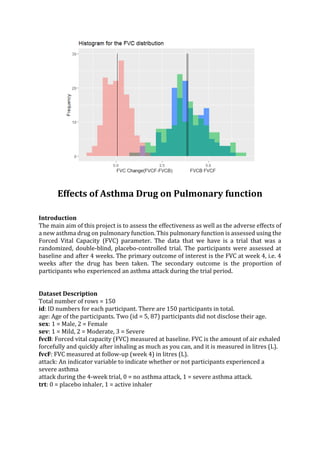
The FVCB and FVCF variables are normally distributed and are not skewed as can be seen
in the graphs below.
From the above histogram, we observe that there is a common pattern between the FVCB,
FVCF and FVCchange values. The pattern somewhat resembles a bell-shaped curve which
is a representation of a normal distribution. The mean of FVCB and FVCF are 3.813933
and 3.892333 respectively. The mean of the FVC change is centered at 0.078400.
Box Plots
The boxplot above, explains the five-number summary i.e. the minimum, first quartile,
median, third quartile and maximum of the forced vital capacity change for the two
treatment groups: Active Inhaler and Placebo Inhaler.
For the Active Inhaler, we observe that more values lie in the first quartile (approximately
-0.25 to +0.25)whereas the values for the placebo treatment are equally distributed in all
the quartiles. The median for the Active inhaler is positive however for the placebo
treatment is negative.
From the above figure, we can conclude that the change in FVC for the Active inhaler is
distributed on the positive side more as compared to the placebo inhaler samples.
Quantile-Quantile NORMAL plots
A QQ plot is a scatter plot created by plotting two sets of quantiles against one another. If
both sets of quantiles are from the same distribution we should see that the line forming
is roughly straight. The plots below show that the FVCB, FVCF, and the FVCchange values
are normally distributed with the number of values lying equally on both sides of the
center zero on the x-axis which corresponds to the mean value of the distribution.
Asthma drug
Assumptions of the Two-sample t-test are as follows:
Samples have to be independent.
Samples have to be normally distributed and n<30
Since the number of samples is more than 30 a normal sampling distribution can be used.
R uses the t-test for this approach.
Results
Randomness of Data
We know that the trial is randomized. To check the randomness of this data let is compare
the averages and proportions of the samples in the two treatment categories.
Variable
Treatment with
Placebo Inhaler
Treatment with Active Inhaler
Sex (n(%))
Female 45 (57.69%) 32 (44.44%)
Male 33 (42.30%) 40 (55.56%)
Severity
Mild 16 (20.51%) 20 (27.77%)
Moderate 36 (46.15%) 33 (45.83%)
Severe 26 (33.33%) 19 (26.38%)
Age Group
Below 10 years 0(0%) 1(1.42%)
Oct-20 4(5.12%) 9(12.85%)
21-30 10(12.82%) 10(14.28%)
31-40 24(30.77%) 12(17.14%)
41-50 26(33.33%) 22(31.42%)
51-60 10(12.82%) 12(5.71%)
61 and above 4(5.12%) 4(1.43%)
From the table above, we observe that there appeared to be slightly more females using
the placebo inhaler(57.7%) as compared to the females using an active inhaler (44.44%).
An approximate reverse is seen among males.
There appears to be a slightly more number of patients with severe asthma using a
placebo inhaler(33.33%) as compared to the ones using the active inhaler(26.38%). An
approximate reverse can be seen for patients with mild asthma, whereas the percentages
are approximately equal for patients with moderate asthma.
I have considered age-groups to categorize the samples and tried to compare the
proportion of samples for the different age groups. When we compare the age groups we
observe that there appears to be more number of patients in the age group 10-20 using
an active inhaler(12.85%) as compared to patients using a placebo inhaler(5.12%). The
reverse is seen for the age group 51-60 and 31-40. Approximately, an equal number of
patients are there in the age groups 21-30, 41-50 and 61 and above.
Overall, we see that the means, standard deviations, and percentages for the various
groups like sex, severity and age group do not differ by a very significant amount.
Therefore, it appears that randomization has worked and that the two treatment groups
are very similar concerning these groups.
Statistics at Baseline and Week 4
Placebo Inhaler Active Inhaler
FVC at Baseline in Litres
Mean(SD)
3.71641(SD: 0.9750231) 3.919583(SD: 1.094511)
FVC at week 4
Mean(SD)
3.674872(SD: 1.090891) 4.127917(SD: 1.24397)
From the table above, we observe no noticeable difference in the mean and SD for the FVC
variable at baseline for the Placebo and Active Inhaler. However, there is a slight increase
in the average FVC at week 4 with the use of the Active inhaler.
Two-sample t-test statistic at baseline and at week 4
Using the two-sample t-test statistic to compare the change in FVC for the two groups:
Placebo Inhaler and Active Inhaler. The first t-test is the comparison as Baseline and
the second t-test is the value at week 4
Comparisons of the difference from the above t-test. FVCchange = (FVCF - FVCB)
I added a column to the dataset called fvc_change which was computed as fvc_change =
FVCF-FVCB.
The average FVC change in the Active group is 0.2083 L whilst for the placebo group it is
0.04153 L, a difference of 0.25L with associated 95% CI 0.055L to 0.445L, and a P-
value=0.01253, i.e. less than 0.05.
From the Output above we that there is a statistically significant improvement in FVC in
patients using Active inhaler as compared to placebo inhaler.
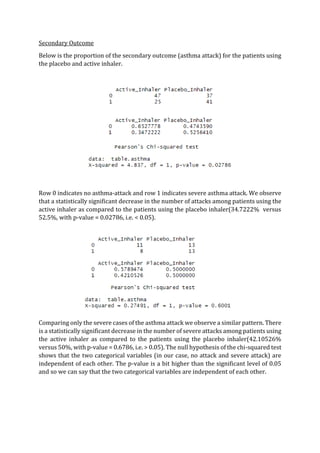
Secondary Outcome
Below is the proportion of the secondary outcome (asthma attack) for the patients using
the placebo and active inhaler.
Row 0 indicates no asthma-attack and row 1 indicates severe asthma attack. We observe
that a statistically significant decrease in the number of attacks among patients using the
active inhaler as compared to the patients using the placebo inhaler(34.7222% versus
52.5%, with p-value = 0.02786, i.e. < 0.05).
Comparing only the severe cases of the asthma attack we observe a similar pattern. There
is a statistically significant decrease in the number of severe attacks among patients using
the active inhaler as compared to the patients using the placebo inhaler(42.10526%
versus 50%, with p-value = 0.6786, i.e. > 0.05). The null hypothesis of the chi-squared test
shows that the two categorical variables (in our case, no attack and severe attack) are
independent of each other. The p-value is a bit higher than the significant level of 0.05
and so we can say that the two categorical variables are independent of each other.
Discussion
From the statistics presented above, the primary outcome i.e. the Forced Vital Capacity
(the amount of air exhaled in liters) improved among patients using the Active inhaler as
compared to the patients using the placebo inhaler. However, this difference that we see
between the two treatments is not very large. The secondary outcome is the study of who
experienced a severe asthma attack during the trial period. We observe that there is a
statistically significant decrease in the number of severe attacks among patients using the
active inhaler as compared to the patients using the placebo inhaler.
To achieve a power of 80% at a 5% significance level and a minimum clinically significant
difference of 0.5 litres we require a sample size of approximately 72 for each category of
data i.e. for placebo and active categories. To achieve a power of 90%, we require a
sample set of size 97 for each category of data i.e. for placebo and active categories.
More Related Content

Asthma drug

  • 1. Effects of Asthma Drug on Pulmonary function Introduction The main aim of this project is to assess the effectiveness as well as the adverse effects of a new asthma drug on pulmonary function. This pulmonary function is assessed using the Forced Vital Capacity (FVC) parameter. The data that we have is a trial that was a randomized, double-blind, placebo-controlled trial. The participants were assessed at baseline and after 4 weeks. The primary outcome of interest is the FVC at week 4, i.e. 4 weeks after the drug has been taken. The secondary outcome is the proportion of participants who experienced an asthma attack during the trial period. Dataset Description Total number of rows = 150 id: ID numbers for each participant. There are 150 participants in total. age: Age of the participants. Two (id = 5, 87) participants did not disclose their age. sex: 1 = Male, 2 = Female sev: 1 = Mild, 2 = Moderate, 3 = Severe fvcB: Forced vital capacity (FVC) measured at baseline. FVC is the amount of air exhaled forcefully and quickly after inhaling as much as you can, and it is measured in litres (L). fvcF: FVC measured at follow-up (week 4) in litres (L). attack: An indicator variable to indicate whether or not participants experienced a severe asthma attack during the 4-week trial, 0 = no asthma attack, 1 = severe asthma attack. trt: 0 = placebo inhaler, 1 = active inhaler
  • 2. Methods As we observe, the dataset has one Dependent Variable (column trt) with two levels of independent variables (0 = placebo inhaler, 1 = active inhaler). The nature of the FVC values being normal I have used the 2 independent sample t-test to study the difference between the placebo inhaler and the active inhaler. To compare the side-effects of the drug I have used probabilities and Chi-squared tests. The FVCB and FVCF variables are normally distributed and are not skewed as can be seen in the graphs below. From the above histogram, we observe that there is a common pattern between the FVCB, FVCF and FVCchange values. The pattern somewhat resembles a bell-shaped curve which is a representation of a normal distribution. The mean of FVCB and FVCF are 3.813933 and 3.892333 respectively. The mean of the FVC change is centered at 0.078400.
  • 3. Box Plots The boxplot above, explains the five-number summary i.e. the minimum, first quartile, median, third quartile and maximum of the forced vital capacity change for the two treatment groups: Active Inhaler and Placebo Inhaler. For the Active Inhaler, we observe that more values lie in the first quartile (approximately -0.25 to +0.25)whereas the values for the placebo treatment are equally distributed in all the quartiles. The median for the Active inhaler is positive however for the placebo treatment is negative. From the above figure, we can conclude that the change in FVC for the Active inhaler is distributed on the positive side more as compared to the placebo inhaler samples. Quantile-Quantile NORMAL plots A QQ plot is a scatter plot created by plotting two sets of quantiles against one another. If both sets of quantiles are from the same distribution we should see that the line forming is roughly straight. The plots below show that the FVCB, FVCF, and the FVCchange values are normally distributed with the number of values lying equally on both sides of the center zero on the x-axis which corresponds to the mean value of the distribution.
  • 5. Assumptions of the Two-sample t-test are as follows: Samples have to be independent. Samples have to be normally distributed and n<30 Since the number of samples is more than 30 a normal sampling distribution can be used. R uses the t-test for this approach. Results Randomness of Data We know that the trial is randomized. To check the randomness of this data let is compare the averages and proportions of the samples in the two treatment categories. Variable Treatment with Placebo Inhaler Treatment with Active Inhaler Sex (n(%)) Female 45 (57.69%) 32 (44.44%) Male 33 (42.30%) 40 (55.56%) Severity Mild 16 (20.51%) 20 (27.77%) Moderate 36 (46.15%) 33 (45.83%) Severe 26 (33.33%) 19 (26.38%) Age Group Below 10 years 0(0%) 1(1.42%) Oct-20 4(5.12%) 9(12.85%) 21-30 10(12.82%) 10(14.28%) 31-40 24(30.77%) 12(17.14%) 41-50 26(33.33%) 22(31.42%) 51-60 10(12.82%) 12(5.71%) 61 and above 4(5.12%) 4(1.43%) From the table above, we observe that there appeared to be slightly more females using the placebo inhaler(57.7%) as compared to the females using an active inhaler (44.44%). An approximate reverse is seen among males. There appears to be a slightly more number of patients with severe asthma using a placebo inhaler(33.33%) as compared to the ones using the active inhaler(26.38%). An approximate reverse can be seen for patients with mild asthma, whereas the percentages are approximately equal for patients with moderate asthma. I have considered age-groups to categorize the samples and tried to compare the proportion of samples for the different age groups. When we compare the age groups we observe that there appears to be more number of patients in the age group 10-20 using
  • 6. an active inhaler(12.85%) as compared to patients using a placebo inhaler(5.12%). The reverse is seen for the age group 51-60 and 31-40. Approximately, an equal number of patients are there in the age groups 21-30, 41-50 and 61 and above. Overall, we see that the means, standard deviations, and percentages for the various groups like sex, severity and age group do not differ by a very significant amount. Therefore, it appears that randomization has worked and that the two treatment groups are very similar concerning these groups. Statistics at Baseline and Week 4 Placebo Inhaler Active Inhaler FVC at Baseline in Litres Mean(SD) 3.71641(SD: 0.9750231) 3.919583(SD: 1.094511) FVC at week 4 Mean(SD) 3.674872(SD: 1.090891) 4.127917(SD: 1.24397) From the table above, we observe no noticeable difference in the mean and SD for the FVC variable at baseline for the Placebo and Active Inhaler. However, there is a slight increase in the average FVC at week 4 with the use of the Active inhaler. Two-sample t-test statistic at baseline and at week 4 Using the two-sample t-test statistic to compare the change in FVC for the two groups: Placebo Inhaler and Active Inhaler. The first t-test is the comparison as Baseline and the second t-test is the value at week 4
  • 7. Comparisons of the difference from the above t-test. FVCchange = (FVCF - FVCB) I added a column to the dataset called fvc_change which was computed as fvc_change = FVCF-FVCB. The average FVC change in the Active group is 0.2083 L whilst for the placebo group it is 0.04153 L, a difference of 0.25L with associated 95% CI 0.055L to 0.445L, and a P- value=0.01253, i.e. less than 0.05. From the Output above we that there is a statistically significant improvement in FVC in patients using Active inhaler as compared to placebo inhaler.
  • 8. Secondary Outcome Below is the proportion of the secondary outcome (asthma attack) for the patients using the placebo and active inhaler. Row 0 indicates no asthma-attack and row 1 indicates severe asthma attack. We observe that a statistically significant decrease in the number of attacks among patients using the active inhaler as compared to the patients using the placebo inhaler(34.7222% versus 52.5%, with p-value = 0.02786, i.e. < 0.05). Comparing only the severe cases of the asthma attack we observe a similar pattern. There is a statistically significant decrease in the number of severe attacks among patients using the active inhaler as compared to the patients using the placebo inhaler(42.10526% versus 50%, with p-value = 0.6786, i.e. > 0.05). The null hypothesis of the chi-squared test shows that the two categorical variables (in our case, no attack and severe attack) are independent of each other. The p-value is a bit higher than the significant level of 0.05 and so we can say that the two categorical variables are independent of each other.
  • 9. Discussion From the statistics presented above, the primary outcome i.e. the Forced Vital Capacity (the amount of air exhaled in liters) improved among patients using the Active inhaler as compared to the patients using the placebo inhaler. However, this difference that we see between the two treatments is not very large. The secondary outcome is the study of who experienced a severe asthma attack during the trial period. We observe that there is a statistically significant decrease in the number of severe attacks among patients using the active inhaler as compared to the patients using the placebo inhaler. To achieve a power of 80% at a 5% significance level and a minimum clinically significant difference of 0.5 litres we require a sample size of approximately 72 for each category of data i.e. for placebo and active categories. To achieve a power of 90%, we require a sample set of size 97 for each category of data i.e. for placebo and active categories.