Ayesha.pptx
Download as pptx, pdf0 likes38 views

The document discusses the triple bottom line (TBL) framework for measuring sustainability performance across three dimensions: social, environmental and financial. It provides examples of how businesses, nonprofits and governments have incorporated TBL measurements and indicators into their strategies and decision-making. Specifically, it outlines two regional economic development initiatives - in Cleveland, Ohio and Grand Rapids, Michigan - that have adopted TBL approaches to encourage sustainable economic growth through cooperation across multiple stakeholders.
Ayesha.pptx
- 1. The Triple Bottom Line: What Is It and How Does It Work? Presented by: Ayesha Khan
- 2. Introduction ïĩ Sustainability has been an often mentioned goal of businesses, nonprofits and governments in the past decade, yet measuring the degree to which an organization is being sustainable or pursuing sustainable growth can be difficult. ïĩ Interest in triple bottom line accounting has been growing across for-profit, nonprofit and government sectors.
- 3. Aim of the Article ïĩ This article reviews the TBL concept, explains how it can be useful for businesses, policy-makers and economic development practitioners and highlights some current examples of putting the TBL into practice.
- 4. The Triple Bottom Line The TBL is an accounting framework that incorporates three dimensions of performance: ïĩ Social performance ïĩ Environmental performance ïĩ Financial performance The TBL dimensions are also commonly called the three Ps: ïĩ People ïĩ Planet ïĩ Profits
- 5. Calculating the TBL The 3Ps do not have a common unit of measure. ïĩ Profits are measured in dollars. ïĩ What is social capital measured in? ïĩ What about environmental or ecological health? Finding a common unit of measurement is one challenge. In this way, one eliminates the incompatible units issue and, as long as there is a universally accepted accounting method, allows for comparisons between entities, e.g., comparing performance between companies, cities, development projects or some other benchmark.
- 6. Calculating the TBL An example of an index that compares a county versus the nationâs performance for a variety of components is the Indiana Business Research Centerâs Innovation Index. There remains some subjectivity even when using an index however. For example: ïĩ How are the index components weighted? ïĩ Would each âPâ get equal weighting? ïĩ What about the sub-components within each âPâ? ïĩ Do they each get equal weighting? ïĩ Is the people category more important than the planet? ïĩ Who decides?
- 7. What Measures Go into the Index? There is no universal standard method for calculating the TBL. Neither is there a universally accepted standard for the measures that comprise each of the three TBL categories. ïĩ Needs of different entities (businesses or nonprofits) ïĩ Different projects or policies (infrastructure investment or educational programs) ïĩ Different geographic boundaries (a city, region or country)
- 8. Economic Measures Economic variables ought to be variables that deal with the bottom line and the flow of money. It could look at income or expenditures, taxes, business climate factors, employment, and business diversity factors. Specific examples include: ïĩ Personal income ïĩ Cost of underemployment ïĩ Establishment churn ïĩ Establishment sizes ïĩ Job growth ïĩ Employment distribution by sector ïĩ Percentage of firms in each sector ïĩ Revenue by sector contributing to gross state product
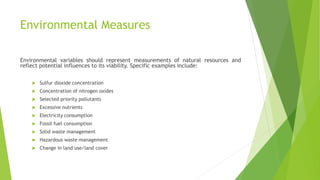
- 9. Environmental Measures Environmental variables should represent measurements of natural resources and reflect potential influences to its viability. Specific examples include: ïĩ Sulfur dioxide concentration ïĩ Concentration of nitrogen oxides ïĩ Selected priority pollutants ïĩ Excessive nutrients ïĩ Electricity consumption ïĩ Fossil fuel consumption ïĩ Solid waste management ïĩ Hazardous waste management ïĩ Change in land use/land cover
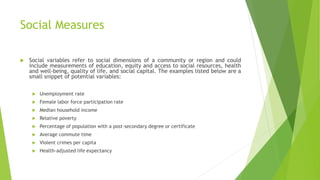
- 10. Social Measures ïĩ Social variables refer to social dimensions of a community or region and could include measurements of education, equity and access to social resources, health and well-being, quality of life, and social capital. The examples listed below are a small snippet of potential variables: ïĩ Unemployment rate ïĩ Female labor force participation rate ïĩ Median household income ïĩ Relative poverty ïĩ Percentage of population with a post-secondary degree or certificate ïĩ Average commute time ïĩ Violent crimes per capita ïĩ Health-adjusted life expectancy
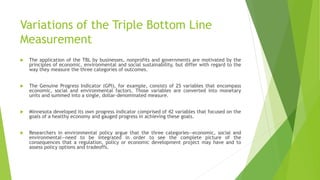
- 11. Variations of the Triple Bottom Line Measurement ïĩ The application of the TBL by businesses, nonprofits and governments are motivated by the principles of economic, environmental and social sustainability, but differ with regard to the way they measure the three categories of outcomes. ïĩ The Genuine Progress Indicator (GPI), for example, consists of 25 variables that encompass economic, social and environmental factors. Those variables are converted into monetary units and summed into a single, dollar-denominated measure. ïĩ Minnesota developed its own progress indicator comprised of 42 variables that focused on the goals of a healthy economy and gauged progress in achieving these goals. ïĩ Researchers in environmental policy argue that the three categoriesâeconomic, social and environmentalâneed to be integrated in order to see the complete picture of the consequences that a regulation, policy or economic development project may have and to assess policy options and tradeoffs.
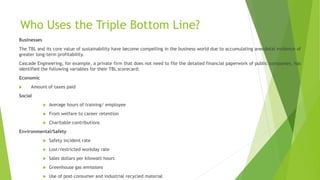
- 12. Who Uses the Triple Bottom Line? Businesses The TBL and its core value of sustainability have become compelling in the business world due to accumulating anecdotal evidence of greater long-term profitability. Cascade Engineering, for example, a private firm that does not need to file the detailed financial paperwork of public companies, has identified the following variables for their TBL scorecard: Economic ïĩ Amount of taxes paid Social ïĩ Average hours of training/ employee ïĩ From welfare to career retention ïĩ Charitable contributions Environmental/Safety ïĩ Safety incident rate ïĩ Lost/restricted workday rate ïĩ Sales dollars per kilowatt hours ïĩ Greenhouse gas emissions ïĩ Use of post-consumer and industrial recycled material
- 13. Nonprofits ïĩ Many nonprofit organizations have adopted the TBL and some have partnered with private firms to address broad sustainability issues that affect mutual stakeholders. Their approach includes the following: ïĩ Food and Agriculture (economic) ïĩ Ecological Stewardship (environmental) ïĩ Education and the Arts (social)
- 14. Government ïĩ State, regional and local governments are increasingly adopting the TBL and analogous sustainability assessment frameworks as decision making and performance-monitoring tools. ïĩ Policy-makers use these sustainability assessment frameworks to decide which actions they should or should not take to make society more sustainable. ïĩ Policy-makers want to know the cause and effect relationship between actionsâ projects or policiesâand whether the results move society toward or away from sustainability. ïĩ Internationally, the European Union uses integrated assessment to identify the âlikely positive and negative impacts of proposed policy actions, enabling informed political judgments to be made about the proposal and identify trade-offs in achieving competing objectives.â ïĩ The EU guidelines have themselves been the subject of critique and have undergone several rounds of improvement.16 The process of refining the guidelines shows both the transparency of the process and the EU commitment to integrated assessment.
- 15. Regional Economic Development Initiatives ïĩ The concept of the triple bottom line can be used regionally by communities to encourage economic development growth in a sustainable manner. ïĩ This requires an increased level of cooperation among businesses, nonprofit organizations, governments and citizens of the region. ïĩ The following examples throughout the United States show various ways the TBL concept can be used to grow a regionâs economic base in a sustainable manner.
- 16. Regional Economic Development Initiatives ïĩ Cleveland, Ohio ï In 2009, the mayor of Cleveland convened the Sustainable Cleveland 2019 (SC2019) Summit to bring together hundreds of people interested in applying the principles of sustainability to the design of the local economy. ï The SC2019 is a 10-year initiative to create a sustainable economy in Cleveland by focusing on a TBL-like concept. ï The city uses four key areas for measuring sustainability: the personal and social environment, the natural environment, the built environment (e.g., infrastructure and urban growth patterns) and the business environment.
- 17. Regional Economic Development Initiatives ïĩ Grand Rapids, Michigan, and the Surrounding Region ï In 2005, the Grand Rapids region created the nationâs first âCommunity Sustainability Partnershipâ to develop a roadmap to lead Grand Rapids to sustainability. ï The region employs 14 major indicators related to the regionâs quality of life and environmental factors to determine progress made towards sustainability. Rather than create an index, target goals were established for each indicator. ï More detailed information of the metrics used for each indicator can be found in their TBL report. ï In next slide, a brief explanations of the variables used to measure their TBL.
- 18. Regional Economic Development Initiatives Environmental Quality ïĩ Waste: Trends in recycling, refuse and yard waste ïĩ Energy: Energy consumption, natural gas consumption and alternative fuel usage ïĩ Water: Water consumption ïĩ Air Quality: Toxic release inventory and number of air pollution ozone action days ïĩ Built Environment: Number of LEED registered and certified projects ïĩ Land Use and Natural Habitat: Inventory of land use and forest canopy o Transportation: public transportation ridership
- 19. Regional Economic Development Initiatives Economic Prosperity ïĩ Personal Income: Personal income per capita ïĩ Unemployment: Unemployment rate ïĩ Redevelopment, Reinvestment and Jobs: Results from brownfield redevelopment investment and job creation ïĩ Knowledge Competitiveness: Third-party report ranking U.S. regions
- 20. Regional Economic Development Initiatives Social Capital and Equity ïĩ Safety and Security: Crime statistics ïĩ Educational Attainment: Degree attainment levels ïĩ Health and Wellness: Infant mortality rate and blood lead levels trends Quality of Life: Home ownership, poverty, and reduced price and free lunches trends ïĩ Community Capital: 211 calls for assistance, voter participation and population and ethnicity