#4 B1 topic 1 - continuous and discontinuous variation
- 1. B1TOPIC 1 -VARIATION Continuous And DiscontinuousVariation CVHS GCSE POWERPOINT SHARE
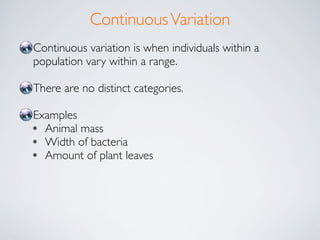
- 2. ContinuousVariation Continuous variation is when individuals within a population vary within a range. There are no distinct categories. Examples ? Animal mass ? Width of bacteria ? Amount of plant leaves
- 5. DiscontinuousVariation Discontinuous variation is when individuals characteristics within a population ?t into two or more distinct categories. There are no intermediate categories. Examples ? Blood group in humans ? Bacteria¡¯s anti-biotic resistance ? how vertebrates respire ? Colour of a courgette
- 8. Practicals Look at the image and think of a practical, and what it shows...
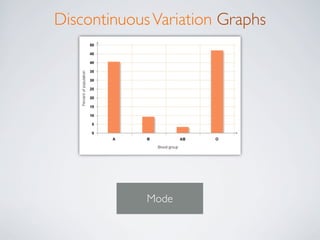
- 9. Practicals Record the eye colour There will be distinct categories such as blue, green etc. This shows discontinuous variationYou would plot the information, and make a bar graph, such as the on to the right.
- 10. Practicals Look at the image and think of a practical, and what it shows...
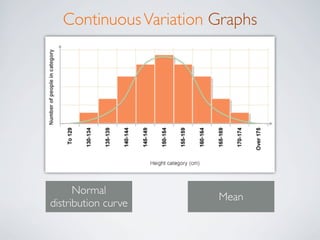
- 11. Practicals Record the hand span There will be lots of different results, nearly all different This shows continuous variationYou would plot the information, and make a graph with a normal distribution curve, such as the on to the right.
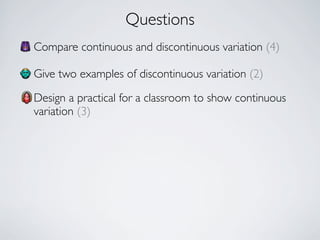
- 12. Questions Compare continuous and discontinuous variation (4) Give two examples of discontinuous variation (2) Design a practical for a classroom to show continuous variation (3)


