Banv
- 1. Performance Aware SDN Bay Area NetworkVirtualization Meetup http://www.meetup.com/openvswitch/ Peter Phaal InMon Corp. May 2013
- 2. Why monitor performance? ÔÇ£If you canÔÇÖt measure it, you canÔÇÖt improve itÔÇØ Lord Kelvin
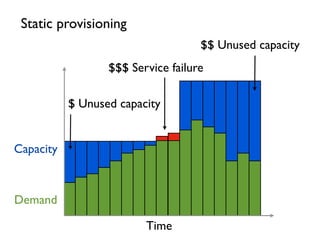
- 3. Time Capacity Demand Static provisioning $ Unused capacity $$$ Service failure $$ Unused capacity
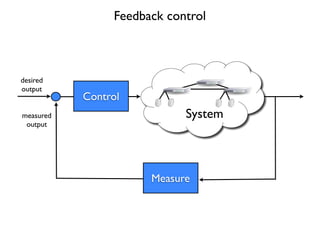
- 6. Controllability and Observability Basic concept is simple, a stable feedback control system requires: 1. ability to in´¼éuence all important system states (controllable) 2. ability to monitor all important system states (observable)
- 7. ItÔÇÖs hard to stay on the road if you canÔÇÖt see the road, or keep to the speed limit without a speedometer ItÔÇÖs hard to stay on the road or maintain speed if your brakes, engine or steering fail Controllability and Observability driving example Observability Controllability States location, speed, direction, ...
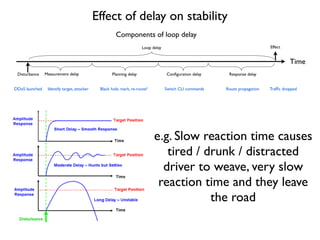
- 8. Effect of delay on stability Measurement delay Planning delay Time Con´¼üguration delayDisturbance Response delay EffectLoop delay DDoS launched Identify target, attacker Black hole, mark, re-route? Switch CLI commands Route propagation Traf´¼üc dropped Components of loop delay e.g. Slow reaction time causes tired / drunk / distracted driver to weave, very slow reaction time and they leave the road
- 9. What is sFlow? ÔÇ£In God we trust. All others bring data.ÔÇØ Dr. Edwards Deming
- 10. Industry standard measurement technology integrated in switches http://www.s´¼éow.org/
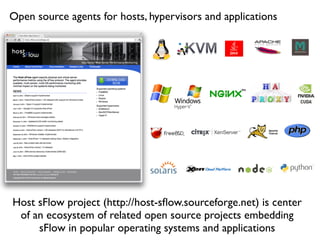
- 11. Open source agents for hosts, hypervisors and applications Host sFlow project (http://host-s´¼éow.sourceforge.net) is center of an ecosystem of related open source projects embedding sFlow in popular operating systems and applications
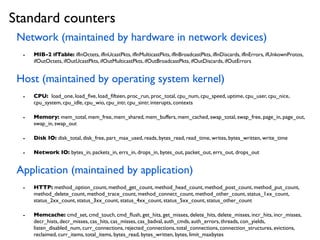
- 12. Network (maintained by hardware in network devices) - MIB-2 ifTable: ifInOctets, ifInUcastPkts, ifInMulticastPkts, ifInBroadcastPkts, ifInDiscards, ifInErrors, ifUnkownProtos, ifOutOctets, ifOutUcastPkts, ifOutMulticastPkts, ifOutBroadcastPkts, ifOutDiscards, ifOutErrors Host (maintained by operating system kernel) - CPU: load_one, load_´¼üve, load_´¼üfteen, proc_run, proc_total, cpu_num, cpu_speed, uptime, cpu_user, cpu_nice, cpu_system, cpu_idle, cpu_wio, cpu_intr, cpu_sintr, interupts, contexts - Memory: mem_total, mem_free, mem_shared, mem_buffers, mem_cached, swap_total, swap_free, page_in, page_out, swap_in, swap_out - Disk IO: disk_total, disk_free, part_max_used, reads, bytes_read, read_time, writes, bytes_written, write_time - Network IO: bytes_in, packets_in, errs_in, drops_in, bytes_out, packet_out, errs_out, drops_out Application (maintained by application) - HTTP: method_option_count, method_get_count, method_head_count, method_post_count, method_put_count, method_delete_count, method_trace_count, method_connect_count, method_other_count, status_1xx_count, status_2xx_count, status_3xx_count, status_4xx_count, status_5xx_count, status_other_count - Memcache: cmd_set, cmd_touch, cmd_´¼éush, get_hits, get_misses, delete_hits, delete_misses, incr_hits, incr_misses, decr_hists, decr_misses, cas_hits, cas_misses, cas_badval, auth_cmds, auth_errors, threads, con_yields, listen_disabled_num, curr_connections, rejected_connections, total_connections, connection_structures, evictions, reclaimed, curr_items, total_items, bytes_read, bytes_written, bytes, limit_maxbytes Standard counters
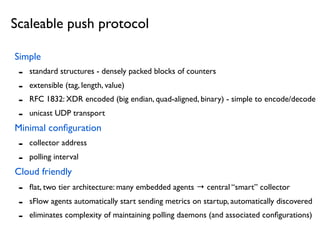
- 13. Simple - standard structures - densely packed blocks of counters - extensible (tag, length, value) - RFC 1832: XDR encoded (big endian, quad-aligned, binary) - simple to encode/decode - unicast UDP transport Minimal con´¼üguration - collector address - polling interval Cloud friendly - ´¼éat, two tier architecture: many embedded agents ÔåÆ central ÔÇ£smartÔÇØ collector - sFlow agents automatically start sending metrics on startup, automatically discovered - eliminates complexity of maintaining polling daemons (and associated con´¼ügurations) Scaleable push protocol
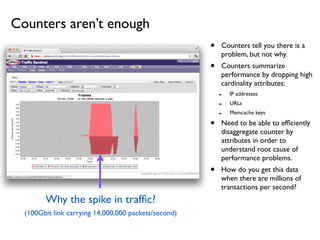
- 14. ÔÇó Counters tell you there is a problem, but not why. ÔÇó Counters summarize performance by dropping high cardinality attributes: - IP addresses - URLs - Memcache keys ÔÇó Need to be able to ef´¼üciently disaggregate counter by attributes in order to understand root cause of performance problems. ÔÇó How do you get this data when there are millions of transactions per second? Counters arenÔÇÖt enough Why the spike in traf´¼üc? (100Gbit link carrying 14,000,000 packets/second)
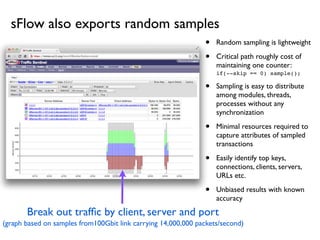
- 15. ÔÇó Random sampling is lightweight ÔÇó Critical path roughly cost of maintaining one counter: if(--skip == 0) sample(); ÔÇó Sampling is easy to distribute among modules, threads, processes without any synchronization ÔÇó Minimal resources required to capture attributes of sampled transactions ÔÇó Easily identify top keys, connections, clients, servers, URLs etc. ÔÇó Unbiased results with known accuracy Break out traf´¼üc by client, server and port (graph based on samples from100Gbit link carrying 14,000,000 packets/second) sFlow also exports random samples
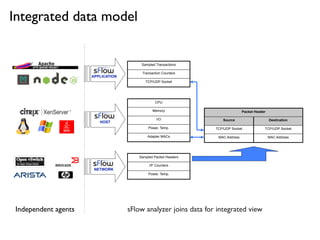
- 16. Integrated data model Packet HeaderPacket Header Source Destination TCP/UDP Socket TCP/UDP Socket MAC Address MAC Address Sampled Packet Headers I/F Counters Power, Temp. NETWORK HOST CPU Memory I/O Power, Temp. Adapter MACs APPLICATION Sampled Transactions Transaction Counters TCP/UDP Socket Independent agents sFlow analyzer joins data for integrated view
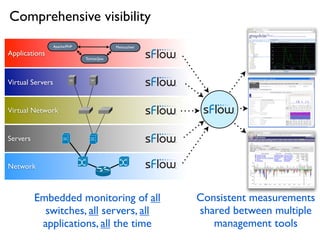
- 17. Virtual Servers Applications Apache/PHP Tomcat/Java Memcached Virtual Network Servers Network Embedded monitoring of all switches, all servers, all applications, all the time Consistent measurements shared between multiple management tools Comprehensive visibility
- 18. Software De´¼üned Networking ÔÇ£You canÔÇÖt control what you canÔÇÖt measureÔÇØ Tom DeMarco
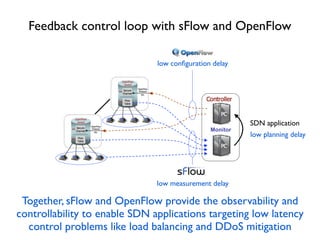
- 19. Monitor Feedback control loop with sFlow and OpenFlow low con´¼üguration delay low measurement delay Together, sFlow and OpenFlow provide the observability and controllability to enable SDN applications targeting low latency control problems like load balancing and DDoS mitigation low planning delay SDN application
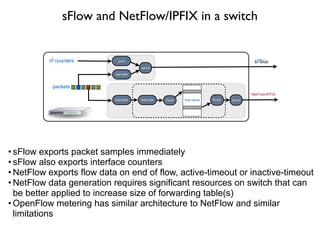
- 20. packets decode hash sendflow cache flushsample NetFlow/IPFIX send polli/f counters sample ÔÇó sFlow exports packet samples immediately ÔÇó sFlow also exports interface counters ÔÇó NetFlow exports flow data on end of flow, active-timeout or inactive-timeout ÔÇó NetFlow data generation requires significant resources on switch that can be better applied to increase size of forwarding table(s) ÔÇó OpenFlow metering has similar architecture to NetFlow and similar limitations sFlow and NetFlow/IPFIX in a switch
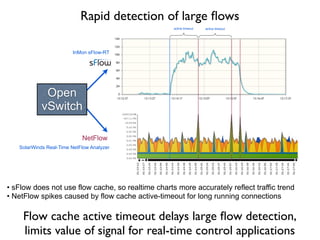
- 21. InMon sFlow-RT active timeout active timeout NetFlow Open vSwitch SolarWinds Real-Time NetFlow Analyzer ÔÇó sFlow does not use flow cache, so realtime charts more accurately reflect traffic trend ÔÇó NetFlow spikes caused by flow cache active-timeout for long running connections Rapid detection of large ´¼éows Flow cache active timeout delays large ´¼éow detection, limits value of signal for real-time control applications
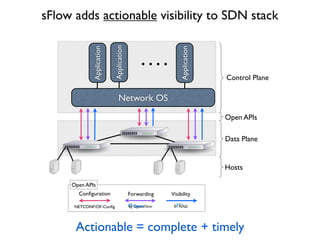
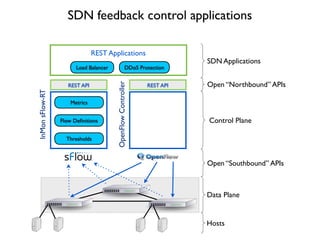
- 22. Network OSApplication Open APIsApplication Application Data Plane Control Plane Con´¼üguration Forwarding Visibility NETCONF/OF-Con´¼üg Open APIs Hosts sFlow adds actionable visibility to SDN stack Actionable = complete + timely
- 23. REST API Metrics Flow De´¼ünitions Thresholds InMonsFlow-RT REST API OpenFlowController Load Balancer DDoS Protection REST Applications Open ÔÇ£SouthboundÔÇØ APIs Data Plane Control Plane Hosts Open ÔÇ£NorthboundÔÇØ APIs SDN Applications SDN feedback control applications
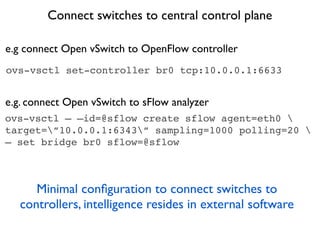
- 24. ovs-vsctl set-controller br0 tcp:10.0.0.1:6633 ovs-vsctl ÔÇö ÔÇôid=@sflow create sflow agent=eth0 target=ÔÇØ10.0.0.1:6343ÔÇØ sampling=1000 polling=20 ÔÇö set bridge br0 sflow=@sflow Connect switches to central control plane e.g connect Open vSwitch to OpenFlow controller e.g. connect Open vSwitch to sFlow analyzer Minimal con´¼üguration to connect switches to controllers, intelligence resides in external software
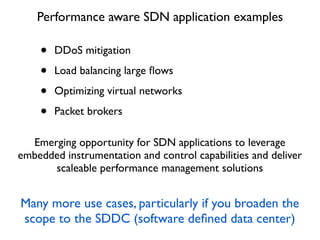
- 25. ÔÇó DDoS mitigation ÔÇó Load balancing large ´¼éows ÔÇó Optimizing virtual networks ÔÇó Packet brokers Performance aware SDN application examples Emerging opportunity for SDN applications to leverage embedded instrumentation and control capabilities and deliver scaleable performance management solutions Many more use cases, particularly if you broaden the scope to the SDDC (software de´¼üned data center)
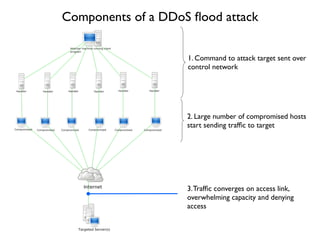
- 26. Components of a DDoS ´¼éood attack 1. Command to attack target sent over control network 2. Large number of compromised hosts start sending traf´¼üc to target 3.Traf´¼üc converges on access link, overwhelming capacity and denying access
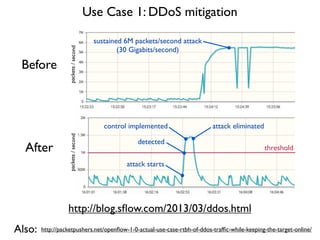
- 27. threshold attack starts detected control implemented attack eliminated http://blog.s´¼éow.com/2013/03/ddos.html Before After Use Case 1: DDoS mitigation packets/secondpackets/second sustained 6M packets/second attack (30 Gigabits/second) http://packetpushers.net/open´¼éow-1-0-actual-use-case-rtbh-of-ddos-traf´¼üc-while-keeping-the-target-online/Also:
- 28. ECMP/LAG multi-path traf´¼üc distribution http://static.usenix.org/event/nsdi10/tech/full_papers/al-fares.pdf index = hash(packet fields) % linkgroup.size selected_link = linkgroup[index] Hash collisions reduce effective cross sectional bandwidth 1:1 subscription ratio doesnÔÇÖt eliminate blocking, collision probabilities are high, even with large numbers of paths
- 29. Birthday Paradox What is the chance that at least two people in a room will share a birthday? 50/50 chance with 23 people, virtual certainty with the 90 people in this room. This is a ÔÇ£paradoxÔÇØ because the probability seems remarkably high considering that there are 365 possible birthdays (366 if you include Feb 29) and 23 people represents just over 6% of the theoretical maximum and 90 people is only 25%. http://en.wikipedia.org/wiki/Birthday_problem ECMP/LAG/MLAG collision probabilities are surprisingly high
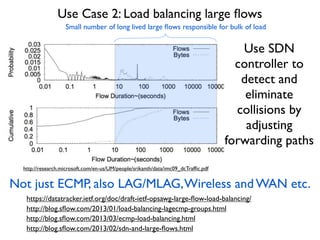
- 30. http://research.microsoft.com/en-us/UM/people/srikanth/data/imc09_dcTraf´¼üc.pdf http://blog.s´¼éow.com/2013/01/load-balancing-lagecmp-groups.html http://blog.s´¼éow.com/2013/03/ecmp-load-balancing.html http://blog.s´¼éow.com/2013/02/sdn-and-large-´¼éows.html Small number of long lived large ´¼éows responsible for bulk of load https://datatracker.ietf.org/doc/draft-ietf-opsawg-large-´¼éow-load-balancing/ Use SDN controller to detect and eliminate collisions by adjusting forwarding paths Use Case 2: Load balancing large ´¼éows Not just ECMP, also LAG/MLAG,Wireless and WAN etc.
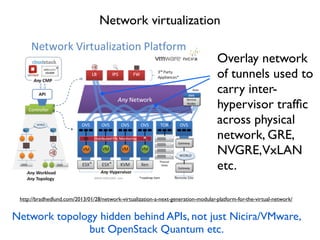
- 31. Network virtualization http://bradhedlund.com/2013/01/28/network-virtualization-a-next-generation-modular-platform-for-the-virtual-network/ Overlay network of tunnels used to carry inter- hypervisor traf´¼üc across physical network, GRE, NVGRE,VxLAN etc. Network topology hidden behind APIs, not just Nicira/VMware, but OpenStack Quantum etc.
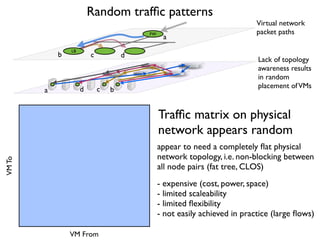
- 32. VMTo VM From FW LB a a b b c c d d Virtual network packet paths Lack of topology awareness results in random placement ofVMs Traf´¼üc matrix on physical network appears random Random traf´¼üc patterns appear to need a completely ´¼éat physical network topology, i.e. non-blocking between all node pairs (fat tree, CLOS) - expensive (cost, power, space) - limited scaleability - limited ´¼éexibility - not easily achieved in practice (large ´¼éows)
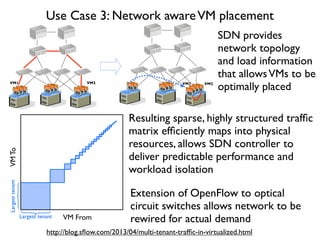
- 33. VMTo VM From Largesttenant Largest tenant Use Case 3: Network awareVM placement VM2 VM1VM1 VM2 SDN provides network topology and load information that allowsVMs to be optimally placed Resulting sparse, highly structured traf´¼üc matrix ef´¼üciently maps into physical resources, allows SDN controller to deliver predictable performance and workload isolation http://blog.s´¼éow.com/2013/04/multi-tenant-traf´¼üc-in-virtualized.html Extension of OpenFlow to optical circuit switches allows network to be rewired for actual demand
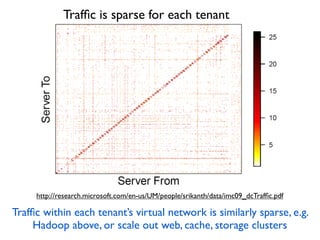
- 34. Traf´¼üc is sparse for each tenant Traf´¼üc within each tenantÔÇÖs virtual network is similarly sparse, e.g. Hadoop above, or scale out web, cache, storage clusters http://research.microsoft.com/en-us/UM/people/srikanth/data/imc09_dcTraf´¼üc.pdf
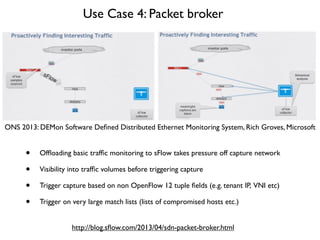
- 35. Use Case 4: Packet broker ONS 2013: DEMon Software De´¼üned Distributed Ethernet Monitoring System, Rich Groves, Microsoft http://blog.s´¼éow.com/2013/04/sdn-packet-broker.html ÔÇó Of´¼éoading basic traf´¼üc monitoring to sFlow takes pressure off capture network ÔÇó Visibility into traf´¼üc volumes before triggering capture ÔÇó Trigger capture based on non OpenFlow 12 tuple ´¼üelds (e.g. tenant IP, VNI etc) ÔÇó Trigger on very large match lists (lists of compromised hosts etc.)
- 36. Testbed setup
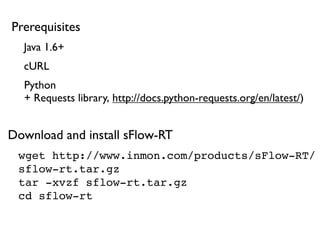
- 37. wget http://www.inmon.com/products/sFlow-RT/ sflow-rt.tar.gz tar -xvzf sflow-rt.tar.gz cd sflow-rt Java 1.6+ Python + Requests library, http://docs.python-requests.org/en/latest/) cURL Prerequisites Download and install sFlow-RT
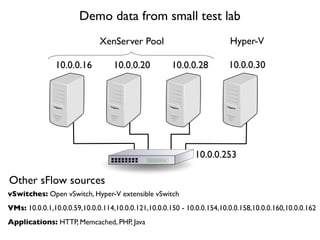
- 38. 10.0.0.16 10.0.0.20 10.0.0.28 XenServer Pool Demo data from small test lab 10.0.0.30 Hyper-V VMs: 10.0.0.1,10.0.0.59,10.0.0.114,10.0.0.121,10.0.0.150 - 10.0.0.154,10.0.0.158,10.0.0.160,10.0.0.162 Applications: HTTP, Memcached, PHP, Java vSwitches: Open vSwitch, Hyper-V extensible vSwitch Other sFlow sources 10.0.0.253
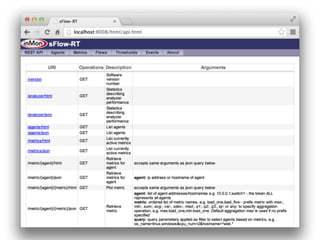
- 41. sFlow-RT REST API commands
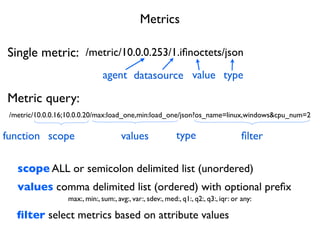
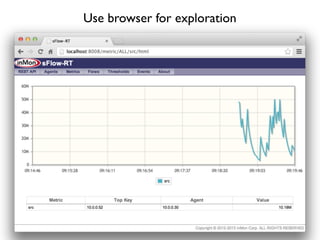
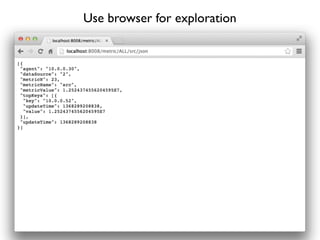
- 42. /metric/10.0.0.16;10.0.0.20/max:load_one,min:load_one/json?os_name=linux,windows&cpu_num=2 scopefunction values type ´¼ülter /metric/10.0.0.253/1.i´¼ünoctets/json agent typevaluedatasource Metrics Single metric: Metric query: scope ALL or semicolon delimited list (unordered) values comma delimited list (ordered) with optional pre´¼üx max:, min:, sum:, avg:, var:, sdev:, med:, q1:, q2:, q3:, iqr: or any: ´¼ülter select metrics based on attribute values
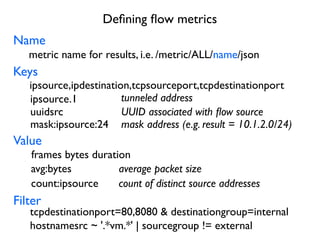
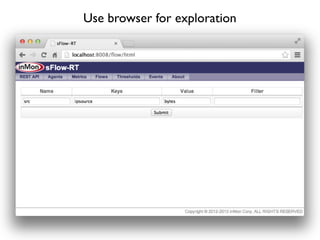
- 43. De´¼üning ´¼éow metrics Keys Value Filter frames bytes duration avg:bytes count:ipsource ipsource,ipdestination,tcpsourceport,tcpdestinationport tcpdestinationport=80,8080 & destinationgroup=internal mask:ipsource:24 Name metric name for results, i.e. /metric/ALL/name/json ipsource.1 tunneled address mask address (e.g. result = 10.1.2.0/24) count of distinct source addresses average packet size uuidsrc UUID associated with ´¼éow source hostnamesrc ~ '.*vm.*' | sourcegroup != external
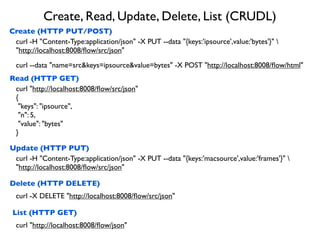
- 44. Create, Read, Update, Delete, List (CRUDL) Create (HTTP PUT/POST) Read (HTTP GET) Update (HTTP PUT) Delete (HTTP DELETE) curl -H "Content-Type:application/json" -X PUT --data "{keys:'ipsource',value:'bytes'}" "http://localhost:8008/´¼éow/src/json" curl "http://localhost:8008/´¼éow/src/json" { "keys": "ipsource", "n": 5, "value": "bytes" } curl -H "Content-Type:application/json" -X PUT --data "{keys:'macsource',value:'frames'}" "http://localhost:8008/´¼éow/src/json" curl -X DELETE "http://localhost:8008/´¼éow/src/json" curl --data "name=src&keys=ipsource&value=bytes" -X POST "http://localhost:8008/´¼éow/html" List (HTTP GET) curl "http://localhost:8008/´¼éow/json"
- 47. Use browser for exploration
- 48. Use browser for exploration
- 49. Use browser for exploration
- 50. import requests eventurl = 'http://localhost:8008/events/json?maxEvents=10&timeout=60' eventID = -1 while 1 == 1: r = requests.get(eventurl + "&eventID=" + str(eventID)) if r.status_code != 200: break events = r.json() if len(events) == 0: continue eventID = events[0]["eventID"] events.reverse() for e in events: print str(e['eventID']) + ',' + str(e['timestamp']) + ',' + e['thresholdID'] + ',' + e['metric'] + ',' + str(e['threshold']) + ',' + str(e['value']) + ',' + e['agent'] + ',' + e['dataSource'] Tail events using HTTP ÔÇ£longÔÇØ polling extras/tail_log.py
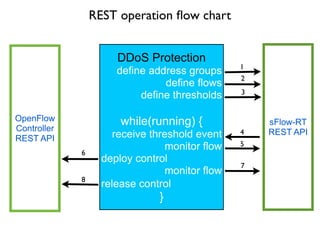
- 51. De´¼üne ´¼éow keys DDoS Protection define address groups define flows define thresholds while(running) { receive threshold event monitor flow deploy control monitor flow release control } OpenFlow Controller REST API sFlow-RT REST API 1 2 3 4 6 5 8 7 REST operation ´¼éow chart
- 52. Large ´¼éow detection script (initialization) import requests import json rt = 'http://localhost:8008' groups = {'external':['0.0.0.0/0'],'internal':['10.0.0.0/8']} flows = { 'keys':'ipsource,ipdestination', 'value':'frames', 'filter':'sourcegroup=external&destinationgroup=internal'} threshold = {'metric':'ddos','value':400} r = requests.put(rt + '/group/json',data=json.dumps(groups)) r = requests.put(rt + '/flow/ddos/json',data=json.dumps(flows)) r = requests.put(rt + '/threshold/ddos/ json',data=json.dumps(threshold)) ... extras/ddos_log.py
- 53. Large ´¼éow detection script (monitor events) ... eventurl = rt + '/events/json?maxEvents=10&timeout=60' eventID = -1 while 1 == 1: r = requests.get(eventurl + "&eventID=" + str(eventID)) if r.status_code != 200: break events = r.json() if len(events) == 0: continue eventID = events[0]["eventID"] events.reverse() for e in events: thresholdID = e['thresholdID'] if "ddos" == thresholdID: r = requests.get(rt + '/metric/' + e['agent'] + '/' + e['dataSource'] + '.' + e['metric'] + '/json') metrics = r.json() if len(metrics) > 0: evtMetric = metrics[0] evtKeys = evtMetric.get('topKeys',None) if(evtKeys and len(evtKeys) > 0): topKey = evtKeys[0] key = topKey.get('key', None) value = topKey.get('value',None) print e['metric'] + "," + e['agent'] + ',' + key + ',' + str(value)
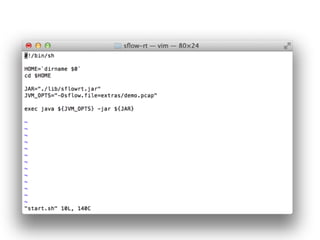
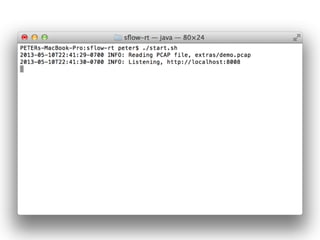
- 54. Next Steps Build your own test bed: 1. sFlow-RT is already installed on your laptop, capable of monitoring thousands of switches (remember to turn off demo.pcap and enable UDP port 6343 on your ´¼ürewall) 2. Enable sFlow in your network (OVS, Hyper-V, physical switches, http://s´¼éow.org/ products/network.php) 3. Install Host sFlow agents http://host-s´¼éow.sourceforge.net/ + application agents:Apache, NGINX,Apache, HAProxy etc. http://host-s´¼éow.sourceforge.net/relatedlinks.php Engage with the broader sFlow community: https://lists.sourceforge.net/lists/listinfo/host-s´¼éow-discuss http://groups.google.com/group/s´¼éow 4.You donÔÇÖt have to have access to a physical test lab, build a Mininet / Open vSwitch virtual test lab, e.g. http://blog.pythonicneteng.com/2013/05/pytapdemon-part-3-pro-active-monitoring.html http://groups.google.com/group/s´¼éow-rt Find out more about sFlow: http://s´¼éow.org/ http://blog.s´¼éow.com/
- 55. Questions?







![ECMP/LAG multi-path traf´¼üc distribution
http://static.usenix.org/event/nsdi10/tech/full_papers/al-fares.pdf
index = hash(packet fields) % linkgroup.size
selected_link = linkgroup[index]
Hash collisions reduce effective cross sectional bandwidth
1:1 subscription ratio doesnÔÇÖt eliminate blocking, collision
probabilities are high, even with large numbers of paths](https://image.slidesharecdn.com/banv-130517021407-phpapp02/85/Banv-28-320.jpg)


![import requests
eventurl = 'http://localhost:8008/events/json?maxEvents=10&timeout=60'
eventID = -1
while 1 == 1:
r = requests.get(eventurl + "&eventID=" + str(eventID))
if r.status_code != 200: break
events = r.json()
if len(events) == 0: continue
eventID = events[0]["eventID"]
events.reverse()
for e in events:
print str(e['eventID']) + ',' + str(e['timestamp']) + ',' +
e['thresholdID'] + ',' + e['metric'] + ',' + str(e['threshold']) + ','
+ str(e['value']) + ',' + e['agent'] + ',' + e['dataSource']
Tail events using HTTP ÔÇ£longÔÇØ polling
extras/tail_log.py](https://image.slidesharecdn.com/banv-130517021407-phpapp02/85/Banv-50-320.jpg)
![Large ´¼éow detection script (initialization)
import requests
import json
rt = 'http://localhost:8008'
groups = {'external':['0.0.0.0/0'],'internal':['10.0.0.0/8']}
flows = {
'keys':'ipsource,ipdestination',
'value':'frames',
'filter':'sourcegroup=external&destinationgroup=internal'}
threshold = {'metric':'ddos','value':400}
r = requests.put(rt + '/group/json',data=json.dumps(groups))
r = requests.put(rt + '/flow/ddos/json',data=json.dumps(flows))
r = requests.put(rt + '/threshold/ddos/
json',data=json.dumps(threshold))
...
extras/ddos_log.py](https://image.slidesharecdn.com/banv-130517021407-phpapp02/85/Banv-52-320.jpg)
![Large ´¼éow detection script (monitor events)
...
eventurl = rt + '/events/json?maxEvents=10&timeout=60'
eventID = -1
while 1 == 1:
r = requests.get(eventurl + "&eventID=" + str(eventID))
if r.status_code != 200: break
events = r.json()
if len(events) == 0: continue
eventID = events[0]["eventID"]
events.reverse()
for e in events:
thresholdID = e['thresholdID']
if "ddos" == thresholdID:
r = requests.get(rt + '/metric/' + e['agent'] + '/' + e['dataSource'] + '.'
+ e['metric'] + '/json')
metrics = r.json()
if len(metrics) > 0:
evtMetric = metrics[0]
evtKeys = evtMetric.get('topKeys',None)
if(evtKeys and len(evtKeys) > 0):
topKey = evtKeys[0]
key = topKey.get('key', None)
value = topKey.get('value',None)
print e['metric'] + "," + e['agent'] + ',' + key + ',' + str(value)](https://image.slidesharecdn.com/banv-130517021407-phpapp02/85/Banv-53-320.jpg)
