Barcamp Gent2008
Download as odp, pdf0 likes708 views

This document summarizes how stacked bar charts, also known as "Yamazumi" charts, can be generated using iText to compare workloads across production workstations. It provides an example chart layout and explains how iText is used to precisely position, scale, and draw each bar and its constituent tasks. Methods are described for handling negative work values by drawing them in a separate stacked bar while preserving the total workload value.
![Bar charts with iText Guy Geens < [email_address] > http://www.iggyland.com/ http://kanonnenpoetser.blogspot.com/ Barcamp Gent 2008](https://image.slidesharecdn.com/barcamp-gent2008-1206822249231419-4/85/Barcamp-Gent2008-1-320.jpg)

![Positioning the graph Determine left and right edges Divide by the number of bars Determine top and bottom coordinates Offsets are determined by header and footer height left = page.left(50); right = page.right(10); x[i] = left + i * (right ŌĆō left) / n; top = page.top(100); bottom = page.bottom(100);](https://image.slidesharecdn.com/barcamp-gent2008-1206822249231419-4/85/Barcamp-Gent2008-8-320.jpg)
Barcamp Gent2008
- 1. Bar charts with iText Guy Geens < [email_address] > http://www.iggyland.com/ http://kanonnenpoetser.blogspot.com/ Barcamp Gent 2008
- 2. Case: Work Balance Board ŌĆ£YamazumiŌĆØ (Japanese: ŌĆ£to stack upŌĆØ) = Stacked bar chart Each stack represents a specific workload on a workstation Used to compare and optimize a production process
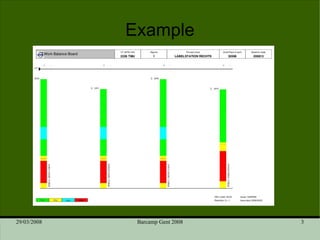
- 3. Example
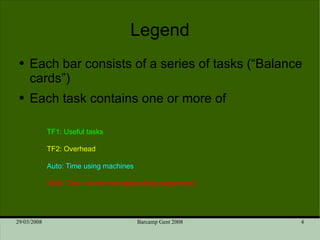
- 4. Each bar consists of a series of tasks (ŌĆ£Balance cardsŌĆØ) Each task contains one or more of Legend TF1: Useful tasks TF2: Overhead Auto: Time using machines Walk: Time spend moving/bending (ergonomy)
- 5. Cycle time = Time available for a single car Determined by line speed ŌĆ£OvershootŌĆØ may lead to line stops Balancing: Distributing tasks between workstations
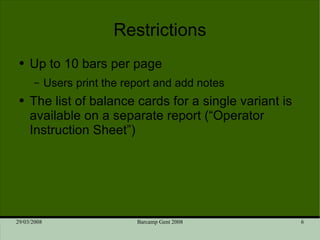
- 6. Restrictions Up to 10 bars per page Users print the report and add notes The list of balance cards for a single variant is available on a separate report (ŌĆ£Operator Instruction SheetŌĆØ)
- 7. Why iText? The report is called from a web application Exact layout is difficult in HTML There is no way to specify ŌĆ£Print in Landscape modeŌĆØ from the server. In iText, this is achieved by: Document doc = new Document(PageSize.A4.rotate());
- 8. Positioning the graph Determine left and right edges Divide by the number of bars Determine top and bottom coordinates Offsets are determined by header and footer height left = page.left(50); right = page.right(10); x[i] = left + i * (right ŌĆō left) / n; top = page.top(100); bottom = page.bottom(100);
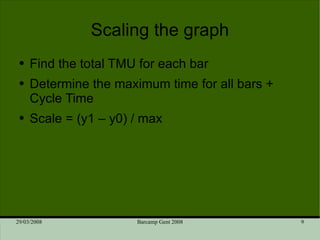
- 9. Scaling the graph Find the total TMU for each bar Determine the maximum time for all bars + Cycle Time Scale = (y1 ŌĆō y0) / max
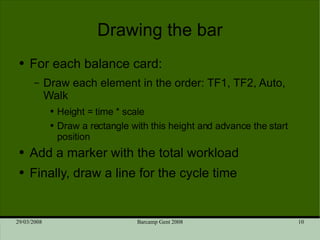
- 10. Drawing the bar For each balance card: Draw each element in the order: TF1, TF2, Auto, Walk Height = time * scale Draw a rectangle with this height and advance the start position Add a marker with the total workload Finally, draw a line for the cycle time
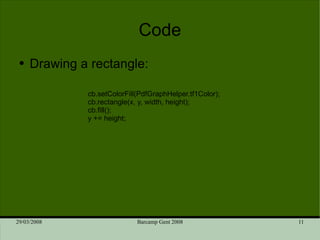
- 11. Code Drawing a rectangle: cb.setColorFill(PdfGraphHelper.tf1Color); cb.rectangle(x, y, width, height); cb.fill(); y += height;
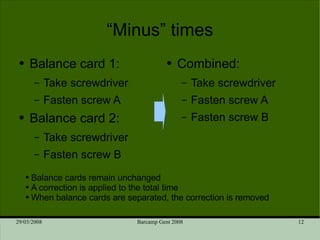
- 12. ŌĆ£MinusŌĆØ times Balance card 1: Take screwdriver Fasten screw A Balance card 2: Take screwdriver Fasten screw B Combined: Take screwdriver Fasten screw A Fasten screw B Balance cards remain unchanged A correction is applied to the total time When balance cards are separated, the correction is removed
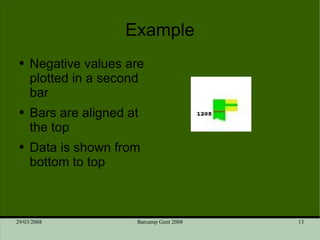
- 13. Example Negative values are plotted in a second bar Bars are aligned at the top Data is shown from bottom to top
- 14. Changes to flow When calculating the scale, only use positive values Gives the height of the main bar Calculate the total of the negative values This is the height of the second bar Positive values go to the main bar, negative values to the secondary bar (absolute values) Workload marker shows the grand total (pos + neg)
- 15. Conclusion iText provides enough detail to show even the smallest bars (size ~10 ŌĆō total size ~2000) Online documentation lacks some information (e.g., coordinate units). There seems to be no way to obtain the position of text elements/tables (for aligning with graphics)
- 16. Thank you for your time Questions?