Basic of statistics
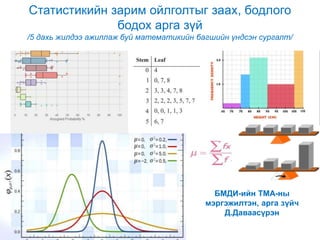
- 1. ąĪčéą░čéąĖčüčéąĖą║ąĖą╣ąĮ ąĘą░čĆąĖą╝ ąŠą╣ą╗ą│ąŠą╗čéčŗą│ ąĘą░ą░čģ, ą▒ąŠą┤ą╗ąŠą│ąŠ ą▒ąŠą┤ąŠčģ ą░čĆą│ą░ ąĘ껹╣ /5 ą┤ą░čģčī ąČąĖą╗ą┤čŹčŹ ą░ąČąĖą╗ą╗ą░ąČ ą▒čāą╣ ą╝ą░č鹥ą╝ą░čéąĖą║ąĖą╣ąĮ ą▒ą░ą│čłąĖą╣ąĮ 껹Įą┤čü菹Į čüčāčĆą│ą░ą╗čé/ ąæą£ąöąś-ąĖą╣ąĮ ąóą£ąÉ-ąĮčŗ ą╝čŹčĆą│菹ȹĖą╗čé菹Į, ą░čĆą│ą░ ąĘ껹╣čć ąö.ąöą░ą▓ą░ą░čüę»čĆ菹Į
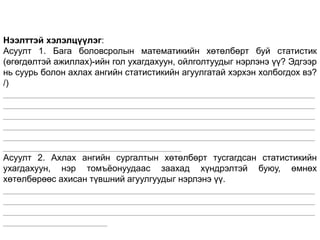
- 2. ąØčŹčŹą╗čéčé菹╣ čģ菹╗菹╗čåę»ę»ą╗菹│: ąÉčüčāčāą╗čé 1. ąæą░ą│ą░ ą▒ąŠą╗ąŠą▓čüčĆąŠą╗čŗąĮ ą╝ą░č鹥ą╝ą░čéąĖą║ąĖą╣ąĮ čģė®čéė®ą╗ą▒ė®čĆčé ą▒čāą╣ čüčéą░čéąĖčüčéąĖą║ (ė®ą│ė®ą│ą┤ė®ą╗čé菹╣ ą░ąČąĖą╗ą╗ą░čģ)-ąĖą╣ąĮ ą│ąŠą╗ čāčģą░ą│ą┤ą░čģčāčāąĮ, ąŠą╣ą╗ą│ąŠą╗čéčāčāą┤čŗą│ ąĮčŹčĆą╗菹ĮčŹ ę»ę»? ąŁą┤ą│čŹčŹčĆ ąĮčī čüčāčāčĆčī ą▒ąŠą╗ąŠąĮ ą░čģą╗ą░čģ ą░ąĮą│ąĖą╣ąĮ čüčéą░čéąĖčüčéąĖą║ąĖą╣ąĮ ą░ą│čāčāą╗ą│ą░čéą░ą╣ čģčŹčĆčģ菹Į čģąŠą╗ą▒ąŠą│ą┤ąŠčģ ą▓čŹ? /) _______________________________________________________________ _______________________________________________________________ _______________________________________________________________ _______________________________________________________________ _______________________________________________________________ ____________________________________ ąÉčüčāčāą╗čé 2. ąÉčģą╗ą░čģ ą░ąĮą│ąĖą╣ąĮ čüčāčĆą│ą░ą╗čéčŗąĮ čģė®čéė®ą╗ą▒ė®čĆčé čéčāčüą│ą░ą│ą┤čüą░ąĮ čüčéą░čéąĖčüčéąĖą║ąĖą╣ąĮ čāčģą░ą│ą┤ą░čģčāčāąĮ, ąĮčŹčĆ č鹊ą╝čŖčæąŠąĮčāčāą┤ą░ą░čü ąĘą░ą░čģą░ą┤ čģ껹Įą┤čĆ菹╗čé菹╣ ą▒čāčÄčā, ė®ą╝ąĮė®čģ čģė®čéė®ą╗ą▒ė®čĆė®ė®čü ą░čģąĖčüą░ąĮ čé껹▓čłąĮąĖą╣ ą░ą│čāčāą╗ą│čāčāą┤čŗą│ ąĮčŹčĆą╗菹ĮčŹ ę»ę». _______________________________________________________________ _______________________________________________________________ _______________________________________________________________ _____________________
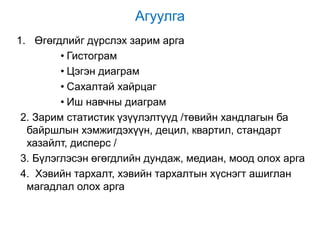
- 3. ąÉą│čāčāą╗ą│ą░ 1. ė©ą│ė®ą│ą┤ą╗ąĖą╣ą│ ą┤ę»čĆčüą╗čŹčģ ąĘą░čĆąĖą╝ ą░čĆą│ą░ ŌĆó ąōąĖčüč鹊ą│čĆą░ą╝ ŌĆó ą”čŹą│菹Į ą┤ąĖą░ą│čĆą░ą╝ ŌĆó ąĪą░čģą░ą╗čéą░ą╣ čģą░ą╣čĆčåą░ą│ ŌĆó ąśčł ąĮą░ą▓čćąĮčŗ ą┤ąĖą░ą│čĆą░ą╝ 2. ąŚą░čĆąĖą╝ čüčéą░čéąĖčüčéąĖą║ 껹Ęę»ę»ą╗菹╗čéę»ę»ą┤ /čéė®ą▓ąĖą╣ąĮ čģą░ąĮą┤ą╗ą░ą│čŗąĮ ą▒ą░ ą▒ą░ą╣čĆčłą╗čŗąĮ čģ菹╝ąČąĖą│ą┤čŹčģę»ę»ąĮ, ą┤ąĄčåąĖą╗, ą║ą▓ą░čĆčéąĖą╗, čüčéą░ąĮą┤ą░čĆčé čģą░ąĘą░ą╣ą╗čé, ą┤ąĖčüą┐ąĄčĆčü / 3. ąæ껹╗菹│ą╗čŹčü菹Į ė®ą│ė®ą│ą┤ą╗ąĖą╣ąĮ ą┤čāąĮą┤ą░ąČ, ą╝ąĄą┤ąĖą░ąĮ, ą╝ąŠąŠą┤ ąŠą╗ąŠčģ ą░čĆą│ą░ 4. ąźčŹą▓ąĖą╣ąĮ čéą░čĆčģą░ą╗čé, čģ菹▓ąĖą╣ąĮ čéą░čĆčģą░ą╗čéčŗąĮ čģę»čüąĮ菹│čé ą░čłąĖą│ą╗ą░ąĮ ą╝ą░ą│ą░ą┤ą╗ą░ą╗ ąŠą╗ąŠčģ ą░čĆą│ą░
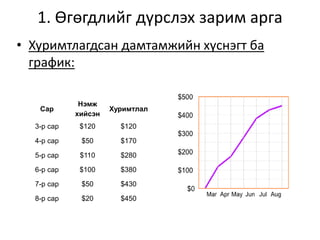
- 4. 1. ė©ą│ė®ą│ą┤ą╗ąĖą╣ą│ ą┤ę»čĆčüą╗čŹčģ ąĘą░čĆąĖą╝ ą░čĆą│ą░ ŌĆó ąźčāčĆąĖą╝čéą╗ą░ą│ą┤čüą░ąĮ ą┤ą░ą╝čéą░ą╝ąČąĖą╣ąĮ čģę»čüąĮ菹│čé ą▒ą░ ą│čĆą░čäąĖą║: ąĪą░čĆ ąØ菹╝ąČ čģąĖą╣čü菹Į ąźčāčĆąĖą╝čéą╗ą░ą╗ 3-čĆ čüą░čĆ $120 $120 4-čĆ čüą░čĆ $50 $170 5-čĆ čüą░čĆ $110 $280 6-čĆ čüą░čĆ $100 $380 7-čĆ čüą░čĆ $50 $430 8-čĆ čüą░čĆ $20 $450
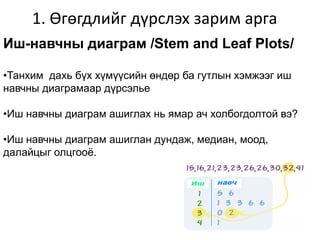
- 5. 1. ė©ą│ė®ą│ą┤ą╗ąĖą╣ą│ ą┤ę»čĆčüą╗čŹčģ ąĘą░čĆąĖą╝ ą░čĆą│ą░ ąśčł-ąĮą░ą▓čćąĮčŗ ą┤ąĖą░ą│čĆą░ą╝ /Stem and Leaf Plots/ ŌĆóąóą░ąĮčģąĖą╝ ą┤ą░čģčī ą▒ę»čģ čģ껹╝ę»ę»čüąĖą╣ąĮ ė®ąĮą┤ė®čĆ ą▒ą░ ą│čāčéą╗čŗąĮ čģ菹╝ąČčŹčŹą│ ąĖčł ąĮą░ą▓čćąĮčŗ ą┤ąĖą░ą│čĆą░ą╝ą░ą░čĆ ą┤ę»čĆčü菹╗čīąĄ ŌĆóąśčł ąĮą░ą▓čćąĮčŗ ą┤ąĖą░ą│čĆą░ą╝ ą░čłąĖą│ą╗ą░čģ ąĮčī čÅą╝ą░čĆ ą░čć čģąŠą╗ą▒ąŠą│ą┤ąŠą╗č鹊ą╣ ą▓čŹ? ŌĆóąśčł ąĮą░ą▓čćąĮčŗ ą┤ąĖą░ą│čĆą░ą╝ ą░čłąĖą│ą╗ą░ąĮ ą┤čāąĮą┤ą░ąČ, ą╝ąĄą┤ąĖą░ąĮ, ą╝ąŠąŠą┤, ą┤ą░ą╗ą░ą╣čåčŗą│ ąŠą╗čåą│ąŠąŠčæ.
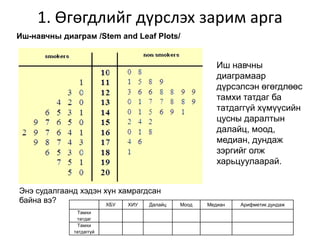
- 6. 1. ė©ą│ė®ą│ą┤ą╗ąĖą╣ą│ ą┤ę»čĆčüą╗čŹčģ ąĘą░čĆąĖą╝ ą░čĆą│ą░ ąśčł ąĮą░ą▓čćąĮčŗ ą┤ąĖą░ą│čĆą░ą╝ą░ą░čĆ ą┤ę»čĆčü菹╗čü菹Į ė®ą│ė®ą│ą┤ą╗ė®ė®čü čéą░ą╝čģąĖ čéą░čéą┤ą░ą│ ą▒ą░ čéą░čéą┤ą░ą│ą│껹╣ čģ껹╝ę»ę»čüąĖą╣ąĮ čåčāčüąĮčŗ ą┤ą░čĆą░ą╗čéčŗąĮ ą┤ą░ą╗ą░ą╣čå, ą╝ąŠąŠą┤, ą╝ąĄą┤ąĖą░ąĮ, ą┤čāąĮą┤ą░ąČ ąĘčŹčĆą│ąĖą╣ą│ ąŠą╗ąČ čģą░čĆčīčåčāčāą╗ą░ą░čĆą░ą╣. ąŁąĮčŹ čüčāą┤ą░ą╗ą│ą░ą░ąĮą┤ čģ菹┤菹Į čģ껹Į čģą░ą╝čĆą░ą│ą┤čüą░ąĮ ą▒ą░ą╣ąĮą░ ą▓čŹ? ąśčł-ąĮą░ą▓čćąĮčŗ ą┤ąĖą░ą│čĆą░ą╝ /Stem and Leaf Plots/ ąźąæąŻ ąźąśąŻ ąöą░ą╗ą░ą╣čå ą£ąŠąŠą┤ ą£ąĄą┤ąĖą░ąĮ ąÉčĆąĖčäą╝ąĄčéąĖą║ ą┤čāąĮą┤ą░ąČ ąóą░ą╝čģąĖ čéą░čéą┤ą░ą│ ąóą░ą╝čģąĖ čéą░čéą┤ą░ą│ą│껹╣
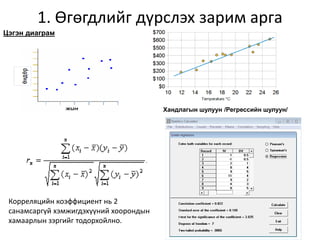
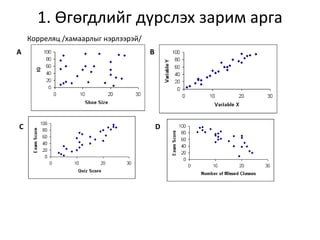
- 7. 1. ė©ą│ė®ą│ą┤ą╗ąĖą╣ą│ ą┤ę»čĆčüą╗čŹčģ ąĘą░čĆąĖą╝ ą░čĆą│ą░ ą”菹│菹Į ą┤ąĖą░ą│čĆą░ą╝ ąźą░ąĮą┤ą╗ą░ą│čŗąĮ čłčāą╗čāčāąĮ /ąĀąĄą│čĆąĄčüčüąĖą╣ąĮ čłčāą╗čāčāąĮ/ ąÜąŠčĆčĆąĄą╗čÅčåąĖą╣ąĮ ą║ąŠčŹčäčäąĖčåąĖąĄąĮčé ąĮčī 2 čüą░ąĮą░ą╝čüą░čĆą│껹╣ čģ菹╝ąČąĖą│ą┤čŹčģę»ę»ąĮąĖą╣ čģąŠąŠčĆąŠąĮą┤čŗąĮ čģą░ą╝ą░ą░čĆą╗čŗąĮ ąĘčŹčĆą│ąĖą╣ą│ č鹊ą┤ąŠčĆčģąŠą╣ą╗ąĮąŠ.
- 8. 1. ė©ą│ė®ą│ą┤ą╗ąĖą╣ą│ ą┤ę»čĆčüą╗čŹčģ ąĘą░čĆąĖą╝ ą░čĆą│ą░ ąÜąŠčĆčĆąĄą╗čÅčå /čģą░ą╝ą░ą░čĆą╗čŗą│ ąĮčŹčĆą╗čŹčŹčĆ菹╣/ A B C D
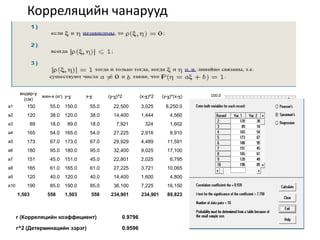
- 9. ąÜąŠčĆčĆąĄą╗čÅčåąĖą╣ąĮ čćą░ąĮą░čĆčāčāą┤ ė®ąĮą┤ė®čĆ-y (čüą╝) ąČąĖąĮ-x (ą║ą│) y-y x-x (y-y)^2 (x-x)^2 (y-y)*(x-x) a1 150 55.0 150.0 55.0 22,500 3,025 8,250.0 a2 120 38.0 120.0 38.0 14,400 1,444 4,560 a3 89 18.0 89.0 18.0 7,921 324 1,602 a4 165 54.0 165.0 54.0 27,225 2,916 8,910 a5 173 67.0 173.0 67.0 29,929 4,489 11,591 a6 180 95.0 180.0 95.0 32,400 9,025 17,100 a7 151 45.0 151.0 45.0 22,801 2,025 6,795 a8 165 61.0 165.0 61.0 27,225 3,721 10,065 a9 120 40.0 120.0 40.0 14,400 1,600 4,800 a10 190 85.0 190.0 85.0 36,100 7,225 16,150 1,503 558 1,503 558 234,901 234,901 89,823 r (ąÜąŠčĆčĆąĄą╗čÅčåąĖą╣ąĮ ą║ąŠčŹčäčäąĖčåąĖąĄąĮčé) 0.9796 r^2 (ąöąĄč鹥čĆą╝ąĖąĮą░čåąĖą╣ąĮ ąĘčŹčĆ菹│) 0.9596 - 10.0 20.0 30.0 40.0 50.0 60.0 70.0 80.0 90.0 100.0 - 50 100 150 200 AxisTitle Axis Title
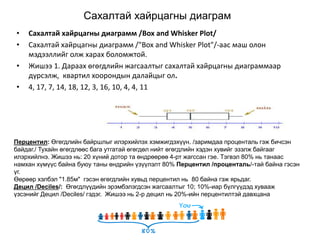
- 10. ąĪą░čģą░ą╗čéą░ą╣ čģą░ą╣čĆčåą░ą│ąĮčŗ ą┤ąĖą░ą│čĆą░ą╝ ŌĆó ąĪą░čģą░ą╗čéą░ą╣ čģą░ą╣čĆčåą░ą│ąĮčŗ ą┤ąĖą░ą│čĆą░ą╝ą╝ /Box and Whisker Plot/ ŌĆó ąĪą░čģą░ą╗čéą░ą╣ čģą░ą╣čĆčåą░ą│ąĮčŗ ą┤ąĖą░ą│čĆą░ą╝ą╝ /"Box and Whisker Plot"/-ą░ą░čü ą╝ą░čł ąŠą╗ąŠąĮ ą╝菹┤čŹčŹą╗ą╗ąĖą╣ą│ ąŠą╗ąČ čģą░čĆą░čģ ą▒ąŠą╗ąŠą╝ąČč鹊ą╣. ŌĆó ą¢ąĖčłčŹčŹ 1. ąöą░čĆą░ą░čģ ė®ą│ė®ą│ą┤ą╗ąĖą╣ąĮ ąČą░ą│čüą░ą░ą╗čéčŗą│ čüą░čģą░ą╗čéą░ą╣ čģą░ą╣čĆčåą░ą│ąĮčŗ ą┤ąĖą░ą│čĆą░ą╝ą╝ą░ą░čĆ ą┤ę»čĆčü菹╗ąČ, ą║ą▓ą░čĆčéąĖą╗ čģąŠąŠčĆąŠąĮą┤čŗąĮ ą┤ą░ą╗ą░ą╣čåčŗą│ ąŠą╗. ŌĆó 4, 17, 7, 14, 18, 12, 3, 16, 10, 4, 4, 11 ą¤ąĄčĆčåąĄąĮčéąĖą╗: ė©ą│ė®ą│ą┤ą╗ąĖą╣ąĮ ą▒ą░ą╣čĆčłą╗čŗą│ ąĖą╗čŹčĆčģąĖą╣ą╗čŹčģ čģ菹╝ąČąĖą│ą┤čŹčģę»ę»ąĮ. /ąĘą░čĆąĖą╝ą┤ą░ą░ ą┐čĆąŠčåąĄąĮčéą░ą╗čī ą│čŹąČ ą▒ąĖčćčü菹Į ą▒ą░ą╣ą┤ą░ą│./ ąóčāčģą░ą╣ąĮ ė®ą│ė®ą│ą┤ą╗ė®ė®čü ą▒ą░ą│ą░ čāčéą│ą░čéą░ą╣ ė®ą│ė®ą│ą┤ė®ą╗ ąĮąĖą╣čé ė®ą│ė®ą│ą┤ą╗ąĖą╣ąĮ čģ菹┤菹Į čģčāą▓ąĖą╣ą│ 菹Ę菹╗ąČ ą▒ą░ą╣ą│ą░ą░ą│ ąĖą╗čŹčĆčģąĖą╣ą╗ąĮčŹ. ą¢ąĖčłčŹčŹ ąĮčī: 20 čģ껹ĮąĖą╣ ą┤ąŠč鹊čĆ čéą░ ė®ąĮą┤čĆė®ė®čĆė®ė® 4-čĆčé ąČą░ą│čüčüą░ąĮ ą│菹Ą. ąó菹│ą▓菹╗ 80% ąĮčī čéą░ąĮą░ą░čü ąĮą░ą╝čģą░ąĮ čģ껹╝ę»ę»čü ą▒ą░ą╣ąĮą░ ą▒čāčÄčā čéą░ąĮčŗ ė®ąĮą┤čĆąĖą╣ąĮ 껹Ęę»ę»ą╗菹╗čé 80% ą¤ąĄčĆčåąĄąĮčéąĖą╗ /ą┐čĆąŠčåąĄąĮčéą░ą╗čī/-čéą░ą╣ ą▒ą░ą╣ąĮą░ ą│čŹčü菹Į 껹│. ė©ė®čĆė®ė®čĆ čģ菹╗ą▒菹╗ "1.85ą╝" ą│čŹčü菹Į ė®ą│ė®ą│ą┤ą╗ąĖą╣ąĮ čģčāą▓čīą┤ ą┐ąĄčĆčåąĄąĮčéąĖą╗ ąĮčī 80 ą▒ą░ą╣ąĮą░ ą│čŹąČ čÅčĆčīą┤ą░ą│. ąöąĄčåąĖą╗ /Deciles/: ė©ą│ė®ą│ą┤ą╗ę»ę»ą┤ąĖą╣ąĮ čŹčĆ菹╝ą▒菹╗菹│ą┤čü菹Į ąČą░ą│čüą░ą░ą╗čéčŗą│ 10; 10%-ąĖą░čĆ ą▒껹╗ą│ę»ę»ą┤菹┤ čģčāą▓ą░ą░ąČ 껹Ęčü菹ĮąĖą╣ą│ ąöąĄčåąĖą╗ /Deciles/ ą│菹┤菹│. ą¢ąĖčłčŹčŹ ąĮčī 2-čĆ ą┤ąĄčåąĖą╗ ąĮčī 20%-ąĖą╣ąĮ ą┐ąĄčĆčåąĄąĮčéąĖą╗čé菹╣ ą┤ą░ą▓čģčåą░ąĮą░
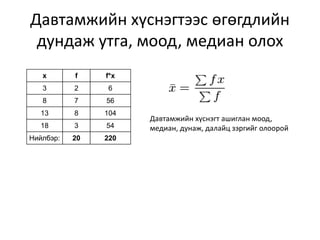
- 11. ąöą░ą▓čéą░ą╝ąČąĖą╣ąĮ čģę»čüąĮ菹│čéčŹčŹčü ė®ą│ė®ą│ą┤ą╗ąĖą╣ąĮ ą┤čāąĮą┤ą░ąČ čāčéą│ą░, ą╝ąŠąŠą┤, ą╝ąĄą┤ąĖą░ąĮ ąŠą╗ąŠčģ x f f*x 3 2 6 8 7 56 13 8 104 18 3 54 ąØąĖą╣ą╗ą▒čŹčĆ: 20 220 ąöą░ą▓čéą░ą╝ąČąĖą╣ąĮ čģę»čüąĮ菹│čé ą░čłąĖą│ą╗ą░ąĮ ą╝ąŠąŠą┤, ą╝ąĄą┤ąĖą░ąĮ, ą┤čāąĮą░ąČ, ą┤ą░ą╗ą░ą╣čå ąĘčŹčĆą│ąĖą╣ą│ ąŠą╗ąŠąŠčĆąŠą╣
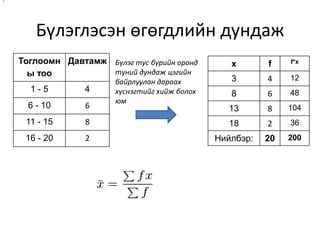
- 12. ąæ껹╗菹│ą╗čŹčü菹Į ė®ą│ė®ą│ą┤ą╗ąĖą╣ąĮ ą┤čāąĮą┤ą░ąČ x f f*x 3 4 12 8 6 48 13 8 104 18 2 36 ąØąĖą╣ą╗ą▒čŹčĆ: 20 200 ąóąŠą│ą╗ąŠąŠą╝ąĮ čŗ č鹊ąŠ ąöą░ą▓čéą░ą╝ąČ 1 - 5 4 6 - 10 6 11 - 15 8 16 - 20 2 ąæ껹╗菹│ čéčāčü ą▒ę»čĆąĖą╣ąĮ ąŠčĆąŠąĮą┤ čé껹ĮąĖą╣ ą┤čāąĮą┤ą░ąČ čå菹│ąĖą╣ąĮ ą▒ą░ą╣čĆą╗čāčāą╗ą░ąĮ ą┤ą░čĆą░ą░čģ čģę»čüąĮ菹│čéąĖą╣ą│ čģąĖą╣ąČ ą▒ąŠą╗ąŠčģ čÄą╝ /
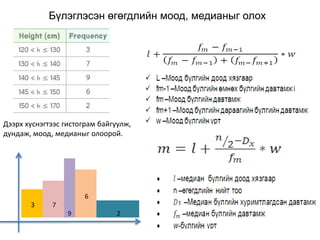
- 13. ąæ껹╗菹│ą╗čŹčü菹Į ė®ą│ė®ą│ą┤ą╗ąĖą╣ąĮ ą╝ąŠąŠą┤, ą╝ąĄą┤ąĖą░ąĮčŗą│ ąŠą╗ąŠčģ ąöčŹčŹčĆčģ čģę»čüąĮ菹│čéčŹčŹčü ą│ąĖčüč鹊ą│čĆą░ą╝ ą▒ą░ą╣ą│čāčāą╗ąČ, ą┤čāąĮą┤ą░ąČ, ą╝ąŠąŠą┤, ą╝ąĄą┤ąĖą░ąĮčŗą│ ąŠą╗ąŠąŠčĆąŠą╣. 9 6 73 2
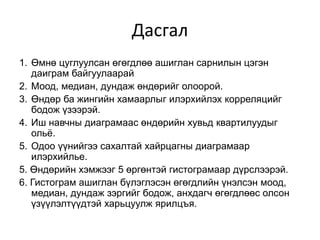
- 14. ąöą░čüą│ą░ą╗ 1. ė©ą╝ąĮė® čåčāą│ą╗čāčāą╗čüą░ąĮ ė®ą│ė®ą│ą┤ą╗ė®ė® ą░čłąĖą│ą╗ą░ąĮ čüą░čĆąĮąĖą╗čŗąĮ čå菹│菹Į ą┤ą░ąĖą│čĆą░ą╝ ą▒ą░ą╣ą│čāčāą╗ą░ą░čĆą░ą╣ 2. ą£ąŠąŠą┤, ą╝ąĄą┤ąĖą░ąĮ, ą┤čāąĮą┤ą░ąČ ė®ąĮą┤ė®čĆąĖą╣ą│ ąŠą╗ąŠąŠčĆąŠą╣. 3. ė©ąĮą┤ė®čĆ ą▒ą░ ąČąĖąĮą│ąĖą╣ąĮ čģą░ą╝ą░ą░čĆą╗čŗą│ ąĖą╗čŹčĆčģąĖą╣ą╗čŹčģ ą║ąŠčĆčĆąĄą╗čÅčåąĖą╣ą│ ą▒ąŠą┤ąŠąČ 껹ĘčŹčŹčĆ菹╣. 4. ąśčł ąĮą░ą▓čćąĮčŗ ą┤ąĖą░ą│čĆą░ą╝ą░ą░čü ė®ąĮą┤ė®čĆąĖą╣ąĮ čģčāą▓čīą┤ ą║ą▓ą░čĆčéąĖą╗čāčāą┤čŗą│ ąŠą╗čīčæ. 5. ą×ą┤ąŠąŠ ę»ę»ąĮąĖą╣ą│čŹčŹ čüą░čģą░ą╗čéą░ą╣ čģą░ą╣čĆčåą░ą│ąĮčŗ ą┤ąĖą░ą│čĆą░ą╝ą░ą░čĆ ąĖą╗čŹčĆčģąĖą╣ą╗čīąĄ. 5. ė©ąĮą┤ė®čĆąĖą╣ąĮ čģ菹╝ąČčŹčŹą│ 5 ė®čĆą│ė®ąĮčé菹╣ ą│ąĖčüč鹊ą│čĆą░ą╝ą░ą░čĆ ą┤ę»čĆčüą╗čŹčŹčĆ菹╣. 6. ąōąĖčüč鹊ą│čĆą░ą╝ ą░čłąĖą│ą╗ą░ąĮ ą▒껹╗菹│ą╗čŹčü菹Į ė®ą│ė®ą│ą┤ą╗ąĖą╣ąĮ 껹Į菹╗čü菹Į ą╝ąŠąŠą┤, ą╝ąĄą┤ąĖą░ąĮ, ą┤čāąĮą┤ą░ąČ ąĘčŹčĆą│ąĖą╣ą│ ą▒ąŠą┤ąŠąČ, ą░ąĮčģą┤ą░ą│čć ė®ą│ė®ą│ą┤ą╗ė®ė®čü ąŠą╗čüąŠąĮ 껹Ęę»ę»ą╗菹╗čéę»ę»ą┤čé菹╣ čģą░čĆčīčåčāčāą╗ąČ čÅčĆąĖą╗čåčŖčÅ.
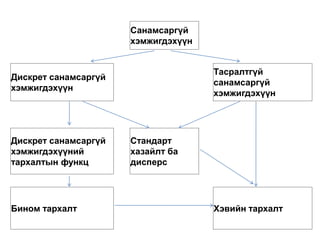
- 15. ąĪą░ąĮą░ą╝čüą░čĆą│껹╣ čģ菹╝ąČąĖą│ą┤čŹčģę»ę»ąĮ ąöąĖčüą║čĆąĄčé čüą░ąĮą░ą╝čüą░čĆą│껹╣ čģ菹╝ąČąĖą│ą┤čŹčģę»ę»ąĮ ąóą░čüčĆą░ą╗čéą│껹╣ čüą░ąĮą░ą╝čüą░čĆą│껹╣ čģ菹╝ąČąĖą│ą┤čŹčģę»ę»ąĮ ąöąĖčüą║čĆąĄčé čüą░ąĮą░ą╝čüą░čĆą│껹╣ čģ菹╝ąČąĖą│ą┤čŹčģę»ę»ąĮąĖą╣ čéą░čĆčģą░ą╗čéčŗąĮ čäčāąĮą║čå ąĪčéą░ąĮą┤ą░čĆčé čģą░ąĘą░ą╣ą╗čé ą▒ą░ ą┤ąĖčüą┐ąĄčĆčü ąæąĖąĮąŠą╝ čéą░čĆčģą░ą╗čé ąźčŹą▓ąĖą╣ąĮ čéą░čĆčģą░ą╗čé
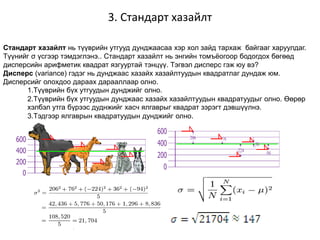
- 16. 3. ąĪčéą░ąĮą┤ą░čĆčé čģą░ąĘą░ą╣ą╗čé ąĪčéą░ąĮą┤ą░čĆčé čģą░ąĘą░ą╣ą╗čé ąĮčī čéę»ę»ą▓čĆąĖą╣ąĮ čāčéą│čāčāą┤ ą┤čāąĮą┤ąČą░ą░čüą░ą░ čģčŹčĆ čģąŠą╗ ąĘą░ą╣ą┤ čéą░čĆčģą░ąČ ą▒ą░ą╣ą│ą░ą░ą│ čģą░čĆčāčāą╗ą┤ą░ą│. ąóę»ę»ąĮąĖą╣ą│ Žā ę»čüą│čŹčŹčĆ čé菹╝ą┤菹│ą╗菹ĮčŹ.. ąĪčéą░ąĮą┤ą░čĆčé čģą░ąĘą░ą╣ą╗čé ąĮčī 菹Įą│ąĖą╣ąĮ č鹊ą╝čŖčæąŠą│ąŠąŠčĆ ą▒ąŠą┤ąŠą│ą┤ąŠčģ ą▒ė®ą│ė®ė®ą┤ ą┤ąĖčüą┐ąĄčĆčüąĖą╣ąĮ ą░čĆąĖčäą╝ąĄčéąĖą║ ą║ą▓ą░ą┤čĆą░čé čÅąĘą│čāčāčĆčéą░ą╣ čé菹Įčåę»ę». ąó菹│ą▓菹╗ ą┤ąĖčüą┐ąĄčĆčü ą│čŹąČ čÄčā ą▓čŹ? ąöąĖčüą┐ąĄčĆčü (variance) ą│菹┤菹│ ąĮčī ą┤čāąĮą┤ąČą░ą░čü čģą░ąĘą░ą╣čģ čģą░ąĘą░ą╣ą╗čéčāčāą┤čŗąĮ ą║ą▓ą░ą┤čĆą░čéą╗ą░ą│ ą┤čāąĮą┤ą░ąČ čÄą╝. ąöąĖčüą┐ąĄčĆčüąĖą╣ą│ ąŠą╗ąŠčģą┤ąŠąŠ ą┤ą░čĆą░ą░čģ ą┤ą░čĆą░ą░ą╗ą╗ą░ą░čĆ ąŠą╗ąĮąŠ. 1.ąóę»ę»ą▓čĆąĖą╣ąĮ ą▒ę»čģ čāčéą│čāčāą┤čŗąĮ ą┤čāąĮą┤ąČąĖą╣ą│ ąŠą╗ąĮąŠ. 2.ąóę»ę»ą▓čĆąĖą╣ąĮ ą▒ę»čģ čāčéą│čāčāą┤čŗąĮ ą┤čāąĮą┤ąČą░ą░čü čģą░ąĘą░ą╣čģ čģą░ąĘą░ą╣ą╗čéčāčāą┤čŗąĮ ą║ą▓ą░ą┤čĆą░čéčāčāą┤čŗą│ ąŠą╗ąĮąŠ. ė©ė®čĆė®čĆ čģ菹╗ą▒菹╗ čāčéą│ą░ ą▒ę»čĆčŹčŹčü ą┤čāą┤ąĮąČąĖą╣ą│ čģą░čüčć čÅą╗ą│ą░ą▓čĆčŗą│ ą║ą▓ą░ą┤čĆą░čé ąĘčŹčĆ菹│čé ą┤菹▓čłę»ę»ą╗ąĮčŹ. 3.ąó菹┤ą│čŹčŹčĆ čÅą╗ą│ą░ą▓čĆčŗąĮ ą║ą▓ą░ą┤čĆą░čéčāčāą┤čŗąĮ ą┤čāąĮą┤ąČąĖą╣ą│ ąŠą╗ąĮąŠ.
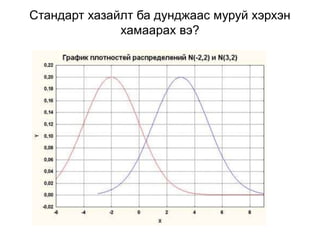
- 18. ąĪčéą░ąĮą┤ą░čĆčé čģą░ąĘą░ą╣ą╗čé ą▒ą░ ą┤čāąĮą┤ąČą░ą░čü ą╝čāčĆčāą╣ čģčŹčĆčģ菹Į čģą░ą╝ą░ą░čĆą░čģ ą▓čŹ?
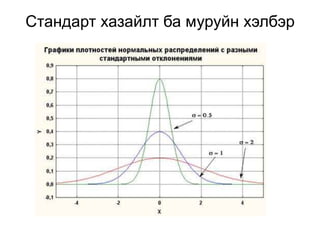
- 19. ąĪčéą░ąĮą┤ą░čĆčé čģą░ąĘą░ą╣ą╗čé ą▒ą░ ą╝čāčĆčāą╣ąĮ čģ菹╗ą▒čŹčĆ
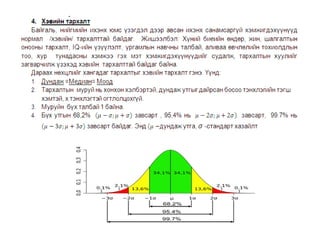
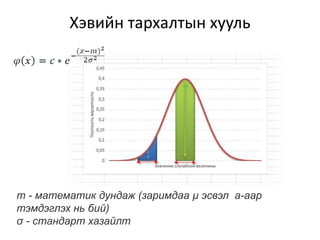
- 20. ąźčŹą▓ąĖą╣ąĮ čéą░čĆčģą░ą╗čéčŗąĮ čģčāčāą╗čī m - ą╝ą░č鹥ą╝ą░čéąĖą║ ą┤čāąĮą┤ą░ąČ (ąĘą░čĆąĖą╝ą┤ą░ą░ ┬Ą čŹčüą▓菹╗ a-ą░ą░čĆ čé菹╝ą┤菹│ą╗čŹčģ ąĮčī ą▒ąĖą╣) Žā - čüčéą░ąĮą┤ą░čĆčé čģą░ąĘą░ą╣ą╗m
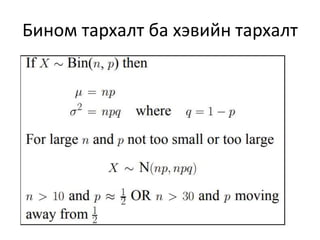
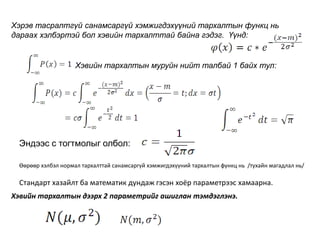
- 21. ąźčŹą▓ąĖą╣ąĮ čéą░čĆčģą░ą╗čéčŗąĮ ą╝čāčĆčāą╣ąĮ ąĮąĖą╣čé čéą░ą╗ą▒ą░ą╣ 1 ą▒ą░ą╣čģ čéčāą╗: ąŁąĮą┤čŹčŹčü čü č鹊ą│čéą╝ąŠą╗čŗą│ ąŠą╗ą▒ąŠą╗: ė©ė®čĆė®ė®čĆ čģ菹╗ą▒菹╗ ąĮąŠčĆą╝ą░ą╗ čéą░čĆčģą░ą╗čéčéą░ą╣ čüą░ąĮą░ą╝čüą░čĆą│껹╣ čģ菹╝ąČąĖą│ą┤čŹčģę»ę»ąĮąĖą╣ čéą░čĆčģą░ą╗čéčŗąĮ čäčāąĮą║čå ąĮčī /čéčāčģą░ą╣ąĮ ą╝ą░ą│ą░ą┤ą╗ą░ą╗ ąĮčī/ ąĪčéą░ąĮą┤ą░čĆčé čģą░ąĘą░ą╣ą╗čé ą▒ą░ ą╝ą░č鹥ą╝ą░čéąĖą║ ą┤čāąĮą┤ą░ąČ ą│čŹčü菹Į čģąŠčæčĆ ą┐ą░čĆą░ą╝ąĄčéčĆčŹčŹčü čģą░ą╝ą░ą░čĆąĮą░. ąźčŹčĆ菹▓ čéą░čüčĆą░ą╗čéą│껹╣ čüą░ąĮą░ą╝čüą░čĆą│껹╣ čģ菹╝ąČąĖą│ą┤čŹčģę»ę»ąĮąĖą╣ čéą░čĆčģą░ą╗čéčŗąĮ čäčāąĮą║čå ąĮčī ą┤ą░čĆą░ą░čģ čģ菹╗ą▒čŹčĆčé菹╣ ą▒ąŠą╗ čģ菹▓ąĖą╣ąĮ čéą░čĆčģą░ą╗čéčéą░ą╣ ą▒ą░ą╣ąĮą░ ą│菹┤菹│. ę«ę»ąĮą┤: ąźčŹą▓ąĖą╣ąĮ čéą░čĆčģą░ą╗čéčŗąĮ ą┤čŹčŹčĆčģ 2 ą┐ą░čĆą░ą╝ąĄčéčĆąĖą╣ą│ ą░čłąĖą│ą╗ą░ąĮ čé菹╝ą┤菹│ą╗菹ĮčŹ.
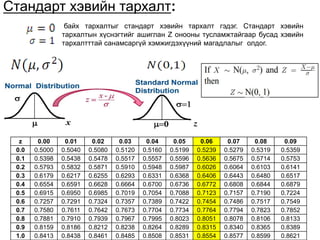
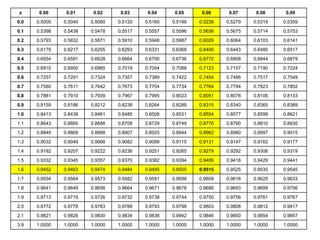
- 22. ąĪčéą░ąĮą┤ą░čĆčé čģ菹▓ąĖą╣ąĮ čéą░čĆčģą░ą╗čé: ą▒ą░ą╣čģ čéą░čĆčģą░ą╗čéčŗą│ čüčéą░ąĮą┤ą░čĆčé čģ菹▓ąĖą╣ąĮ čéą░čĆčģą░ą╗čé ą│菹┤菹│. ąĪčéą░ąĮą┤ą░čĆčé čģ菹▓ąĖą╣ąĮ čéą░čĆčģą░ą╗čéčŗąĮ čģę»čüąĮ菹│čéąĖą╣ą│ ą░čłąĖą│ą╗ą░ąĮ Z ąŠąĮąŠąŠąĮčŗ čéčāčüą╗ą░ą╝ąČčéą░ą╣ą│ą░ą░čĆ ą▒čāčüą░ą┤ čģ菹▓ąĖą╣ąĮ čéą░čĆčģą░ą╗čéčéčéą░ą╣ čüą░ąĮą░ą╝čüą░čĆą│껹╣ čģ菹╝ąČąĖą│ą┤čŹčģę»ę»ąĮąĖą╣ ą╝ą░ą│ą░ą┤ą╗ą░ą╗čŗą│ ąŠą╗ą┤ąŠą│. z 0.00 0.01 0.02 0.03 0.04 0.05 0.06 0.07 0.08 0.09 0.0 0.5000 0.5040 0.5080 0.5120 0.5160 0.5199 0.5239 0.5279 0.5319 0.5359 0.1 0.5398 0.5438 0.5478 0.5517 0.5557 0.5596 0.5636 0.5675 0.5714 0.5753 0.2 0.5793 0.5832 0.5871 0.5910 0.5948 0.5987 0.6026 0.6064 0.6103 0.6141 0.3 0.6179 0.6217 0.6255 0.6293 0.6331 0.6368 0.6406 0.6443 0.6480 0.6517 0.4 0.6554 0.6591 0.6628 0.6664 0.6700 0.6736 0.6772 0.6808 0.6844 0.6879 0.5 0.6915 0.6950 0.6985 0.7019 0.7054 0.7088 0.7123 0.7157 0.7190 0.7224 0.6 0.7257 0.7291 0.7324 0.7357 0.7389 0.7422 0.7454 0.7486 0.7517 0.7549 0.7 0.7580 0.7611 0.7642 0.7673 0.7704 0.7734 0.7764 0.7794 0.7823 0.7852 0.8 0.7881 0.7910 0.7939 0.7967 0.7995 0.8023 0.8051 0.8078 0.8106 0.8133 0.9 0.8159 0.8186 0.8212 0.8238 0.8264 0.8289 0.8315 0.8340 0.8365 0.8389 1.0 0.8413 0.8438 0.8461 0.8485 0.8508 0.8531 0.8554 0.8577 0.8599 0.8621
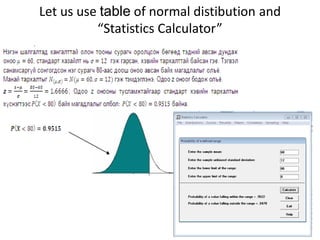
- 23. Let us use table of normal distibution and ŌĆ£Statistics CalculatorŌĆØ
- 24. z 0.00 0.01 0.02 0.03 0.04 0.05 0.06 0.07 0.08 0.09 0.0 0.5000 0.5040 0.5080 0.5120 0.5160 0.5199 0.5239 0.5279 0.5319 0.5359 0.1 0.5398 0.5438 0.5478 0.5517 0.5557 0.5596 0.5636 0.5675 0.5714 0.5753 0.2 0.5793 0.5832 0.5871 0.5910 0.5948 0.5987 0.6026 0.6064 0.6103 0.6141 0.3 0.6179 0.6217 0.6255 0.6293 0.6331 0.6368 0.6406 0.6443 0.6480 0.6517 0.4 0.6554 0.6591 0.6628 0.6664 0.6700 0.6736 0.6772 0.6808 0.6844 0.6879 0.5 0.6915 0.6950 0.6985 0.7019 0.7054 0.7088 0.7123 0.7157 0.7190 0.7224 0.6 0.7257 0.7291 0.7324 0.7357 0.7389 0.7422 0.7454 0.7486 0.7517 0.7549 0.7 0.7580 0.7611 0.7642 0.7673 0.7704 0.7734 0.7764 0.7794 0.7823 0.7852 0.8 0.7881 0.7910 0.7939 0.7967 0.7995 0.8023 0.8051 0.8078 0.8106 0.8133 0.9 0.8159 0.8186 0.8212 0.8238 0.8264 0.8289 0.8315 0.8340 0.8365 0.8389 1.0 0.8413 0.8438 0.8461 0.8485 0.8508 0.8531 0.8554 0.8577 0.8599 0.8621 1.1 0.8643 0.8665 0.8686 0.8708 0.8729 0.8749 0.8770 0.8790 0.8810 0.8830 1.2 0.8849 0.8869 0.8888 0.8907 0.8925 0.8944 0.8962 0.8980 0.8997 0.9015 1.3 0.9032 0.9049 0.9066 0.9082 0.9099 0.9115 0.9131 0.9147 0.9162 0.9177 1.4 0.9192 0.9207 0.9222 0.9236 0.9251 0.9265 0.9279 0.9292 0.9306 0.9319 1.5 0.9332 0.9345 0.9357 0.9370 0.9382 0.9394 0.9406 0.9418 0.9429 0.9441 1.6 0.9452 0.9463 0.9474 0.9484 0.9495 0.9505 0.9515 0.9525 0.9535 0.9545 1.7 0.9554 0.9564 0.9573 0.9582 0.9591 0.9599 0.9608 0.9616 0.9625 0.9633 1.8 0.9641 0.9649 0.9656 0.9664 0.9671 0.9678 0.9686 0.9693 0.9699 0.9706 1.9 0.9713 0.9719 0.9726 0.9732 0.9738 0.9744 0.9750 0.9756 0.9761 0.9767 2.0 0.9772 0.9778 0.9783 0.9788 0.9793 0.9798 0.9803 0.9808 0.9812 0.9817 2.1 0.9821 0.9826 0.9830 0.9834 0.9838 0.9842 0.9846 0.9850 0.9854 0.9857 3.9 1.0000 1.0000 1.0000 1.0000 1.0000 1.0000 1.0000 1.0000 1.0000 1.0000
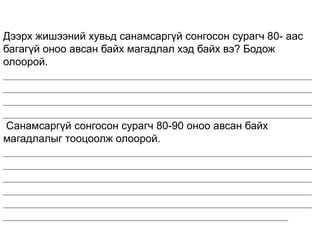
- 25. ąöčŹčŹčĆčģ ąČąĖčłčŹčŹąĮąĖą╣ čģčāą▓čīą┤ čüą░ąĮą░ą╝čüą░čĆą│껹╣ čüąŠąĮą│ąŠčüąŠąĮ čüčāčĆą░ą│čć 80- ą░ą░čü ą▒ą░ą│ą░ą│껹╣ ąŠąĮąŠąŠ ą░ą▓čüą░ąĮ ą▒ą░ą╣čģ ą╝ą░ą│ą░ą┤ą╗ą░ą╗ čģ菹┤ ą▒ą░ą╣čģ ą▓čŹ? ąæąŠą┤ąŠąČ ąŠą╗ąŠąŠčĆąŠą╣. ____________________________________________________ ____________________________________________________ ____________________________________________________ ____________________________________________________ ąĪą░ąĮą░ą╝čüą░čĆą│껹╣ čüąŠąĮą│ąŠčüąŠąĮ čüčāčĆą░ą│čć 80-90 ąŠąĮąŠąŠ ą░ą▓čüą░ąĮ ą▒ą░ą╣čģ ą╝ą░ą│ą░ą┤ą╗ą░ą╗čŗą│ č鹊ąŠčåąŠąŠą╗ąČ ąŠą╗ąŠąŠčĆąŠą╣. ____________________________________________________ ____________________________________________________ ____________________________________________________ ____________________________________________________ ____________________________________________________ ________________________________________________
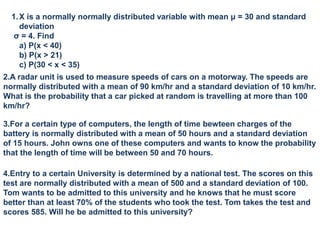
- 26. 1.X is a normally normally distributed variable with mean ╬╝ = 30 and standard deviation Žā = 4. Find a) P(x < 40) b) P(x > 21) c) P(30 < x < 35) 2.A radar unit is used to measure speeds of cars on a motorway. The speeds are normally distributed with a mean of 90 km/hr and a standard deviation of 10 km/hr. What is the probability that a car picked at random is travelling at more than 100 km/hr? 3.For a certain type of computers, the length of time bewteen charges of the battery is normally distributed with a mean of 50 hours and a standard deviation of 15 hours. John owns one of these computers and wants to know the probability that the length of time will be between 50 and 70 hours. 4.Entry to a certain University is determined by a national test. The scores on this test are normally distributed with a mean of 500 and a standard deviation of 100. Tom wants to be admitted to this university and he knows that he must score better than at least 70% of the students who took the test. Tom takes the test and scores 585. Will he be admitted to this university?
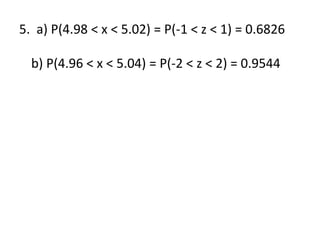
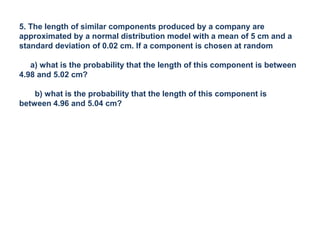
- 27. 5. The length of similar components produced by a company are approximated by a normal distribution model with a mean of 5 cm and a standard deviation of 0.02 cm. If a component is chosen at random a) what is the probability that the length of this component is between 4.98 and 5.02 cm? b) what is the probability that the length of this component is between 4.96 and 5.04 cm?
- 28. ŌĆó Answers to the Above QuestionsNote: What is meant here by area is the area under the standard normal curve. a) For x = 40, the z-value z = (40 - 30) / 4 = 2.5 Hence P(x < 40) = P(z < 2.5) = [area to the left of 2.5] = 0.9938 b) For x = 21, z = (21 - 30) / 4 = -2.25 Hence P(x > 21) = P(z > -2.25) = [total area] - [area to the left of -2.25] = 1 - 0.0122 = 0.9878 c) For x = 30 , z = (30 - 30) / 4 = 0 and for x = 35, z = (35 - 30) / 4 = 1.25 Hence P(30 < x < 35) = P(0 < z < 1.25) = [area to the left of z = 1.25] - [area to the left of 0] = 0.8944 - 0.5 = 0.3944
- 29. 2. Let x be the random variable that represents the speed of cars. x has ╬╝ = 90 and Žā = 10. We have to find the probability that x is higher than 100 or P(x > 100) For x = 100 , z = (100 - 90) / 10 = 1 P(x > 90) = P(z >, 1) = [total area] - [area to the left of z = 1] = 1 - 0.8413 = 0.1587 The probability that a car selected at a random has a speed greater than 100 km/hr is equal to 0.1587
- 30. 3. Let x be the random variable that represents the length of time. It has a mean of 50 and a standard deviation of 15. We have to find the probability that x is between 50 and 70 or P( 50< x < 70) For x = 50 , z = (50 - 50) / 15 = 0 For x = 70 , z = (70 - 50) / 15 = 1.33 (rounded to 2 decimal places) P( 50< x < 70) = P( 0< z < 1.33) = [area to the left of z = 1.33] - [area to the left of z = 0] = 0.9082 - 0.5 = 0.4082 The probability that John's computer has a length of time between 50 and 70 hours is equal to 0.4082.
- 31. 4. Let x be the random variable that represents the scores. x is normally ditsributed with a mean of 500 and a standard deviation of 100. The total area under the normal curve represents the total number of students who took the test. If we multiply the values of the areas under the curve by 100, we obtain percentages. For x = 585 , z = (585 - 500) / 100 = 0.85 The proportion P of students who scored below 585 is given by P = [area to the left of z = 0.85] = 0.8023 = 80.23% Tom scored better than 80.23% of the students who took the test and he will be admitted to this University.
- 32. 5. a) P(4.98 < x < 5.02) = P(-1 < z < 1) = 0.6826 b) P(4.96 < x < 5.04) = P(-2 < z < 2) = 0.9544
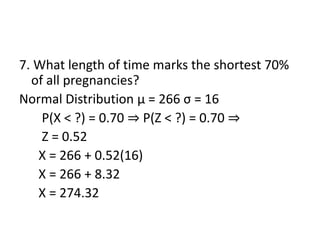
- 33. 7. What length of time marks the shortest 70% of all pregnancies? Normal Distribution ┬Ą = 266 Žā = 16 P(X < ?) = 0.70 ŌćÆ P(Z < ?) = 0.70 ŌćÆ Z = 0.52 X = 266 + 0.52(16) X = 266 + 8.32 X = 274.32
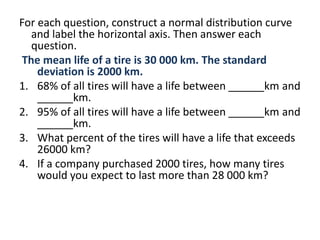
- 34. For each question, construct a normal distribution curve and label the horizontal axis. Then answer each question. The mean life of a tire is 30 000 km. The standard deviation is 2000 km. 1. 68% of all tires will have a life between ______km and ______km. 2. 95% of all tires will have a life between ______km and ______km. 3. What percent of the tires will have a life that exceeds 26000 km? 4. If a company purchased 2000 tires, how many tires would you expect to last more than 28 000 km?
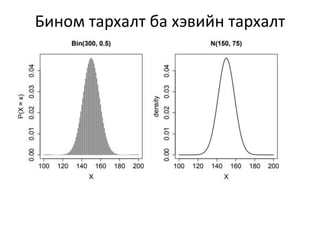
- 35. ąæąĖąĮąŠą╝ čéą░čĆčģą░ą╗čé ą▒ą░ čģ菹▓ąĖą╣ąĮ čéą░čĆčģą░ą╗čé
- 36. ąæąĖąĮąŠą╝ čéą░čĆčģą░ą╗čé ą▒ą░ čģ菹▓ąĖą╣ąĮ čéą░čĆčģą░ą╗čé
![ŌĆó Answers to the Above QuestionsNote: What is meant here by area is the
area under the standard normal curve.
a) For x = 40, the z-value z = (40 - 30) / 4 = 2.5
Hence P(x < 40) = P(z < 2.5) = [area to the left of 2.5] = 0.9938
b) For x = 21, z = (21 - 30) / 4 = -2.25
Hence P(x > 21) = P(z > -2.25) = [total area] - [area to the left of -2.25]
= 1 - 0.0122 = 0.9878
c) For x = 30 , z = (30 - 30) / 4 = 0 and for x = 35, z = (35 - 30) / 4 = 1.25
Hence P(30 < x < 35) = P(0 < z < 1.25) = [area to the left of z = 1.25] - [area
to the left of 0]
= 0.8944 - 0.5 = 0.3944](https://image.slidesharecdn.com/basicofstatistics20180403-180529044511/85/Basic-of-statistics-28-320.jpg)
![2. Let x be the random variable that represents the
speed of cars. x has ╬╝ = 90 and Žā = 10. We have to
find the probability that x is higher than 100 or
P(x > 100)
For x = 100 , z = (100 - 90) / 10 = 1
P(x > 90) = P(z >, 1) = [total area] - [area to the
left of z = 1]
= 1 - 0.8413 = 0.1587
The probability that a car selected at a random
has a speed greater than 100 km/hr is equal to
0.1587](https://image.slidesharecdn.com/basicofstatistics20180403-180529044511/85/Basic-of-statistics-29-320.jpg)
![3. Let x be the random variable that represents the length
of time. It has a mean of 50 and a standard deviation of
15. We have to find the probability that x is between
50 and 70 or P( 50< x < 70)
For x = 50 , z = (50 - 50) / 15 = 0
For x = 70 , z = (70 - 50) / 15 = 1.33 (rounded to 2
decimal places)
P( 50< x < 70) = P( 0< z < 1.33) = [area to the left of z =
1.33] - [area to the left of z = 0]
= 0.9082 - 0.5 = 0.4082
The probability that John's computer has a length of
time between 50 and 70 hours is equal to 0.4082.](https://image.slidesharecdn.com/basicofstatistics20180403-180529044511/85/Basic-of-statistics-30-320.jpg)
![4. Let x be the random variable that represents the scores. x
is normally ditsributed with a mean of 500 and a standard
deviation of 100. The total area under the normal curve
represents the total number of students who took the
test. If we multiply the values of the areas under the curve
by 100, we obtain percentages.
For x = 585 , z = (585 - 500) / 100 = 0.85
The proportion P of students who scored below 585 is
given by
P = [area to the left of z = 0.85] = 0.8023 = 80.23%
Tom scored better than 80.23% of the students who took
the test and he will be admitted to this University.](https://image.slidesharecdn.com/basicofstatistics20180403-180529044511/85/Basic-of-statistics-31-320.jpg)
