

![┐éė[
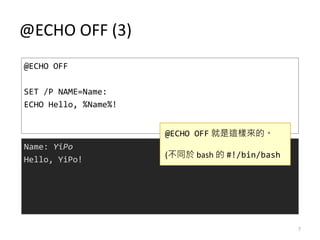
? @ECHO OFF
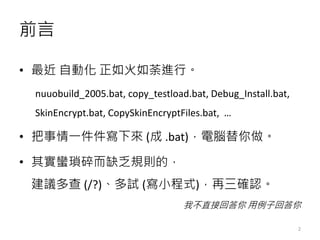
? Ė„╩ĮĘ¹╠¢ė├═Š
? Argument/Return
? ūāöĄā╔ą═
? IF ╚²šą
? FOR ╦─╩Į
? į]ĮŌ
? Block
? Function
? Ųõ╦¹ėæšō
? č▄╔·ķåūx
3](https://image.slidesharecdn.com/batch-intro-151227121206/85/Batch-3-320.jpg)
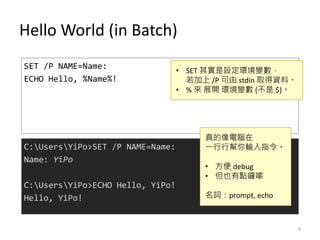
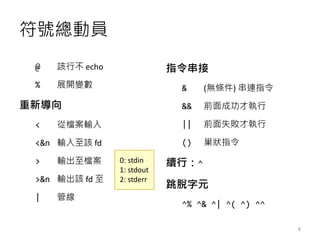
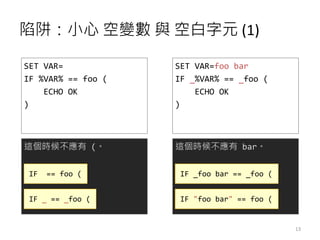
![Input/Output ┼c Argument/Return
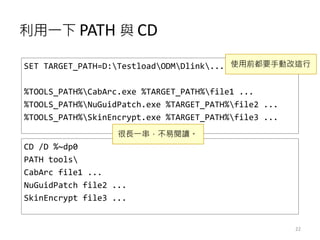
@ECHO OFF
ECHO %0, %*
ECHO %1, %2, %3
SHIFT
ECHO %1, %2, %3
EXIT /B 56
C:UsersYiPoExample.bat, apple banana cat dog
apple, banana, cat
banana, cat, dog
C:UsersYiPo>Example.bat apple banana cat dog
? %0 ų┴ %9Ż¼ø]ėą %10 įōį§³N▐kŻ┐
? EXIT ąUļyė├Ą─Ż¼
¤oĘ©╠°│÷å╬īė batchĪŻ
ąĪĄzįEŻ║┐╔ęįė├═Ž└ŁĘĮ╩ĮjÖn░Ė┬ĘÅĮĮo .batĪŻ
9](https://image.slidesharecdn.com/batch-intro-151227121206/85/Batch-9-320.jpg)
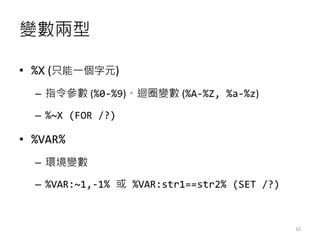
![į]ĮŌ
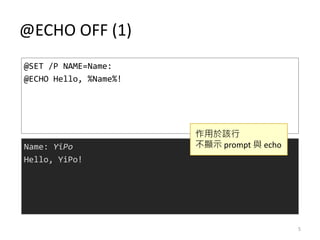
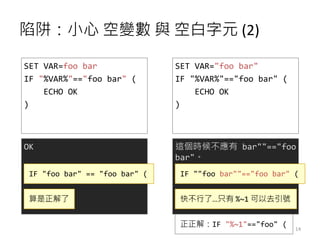
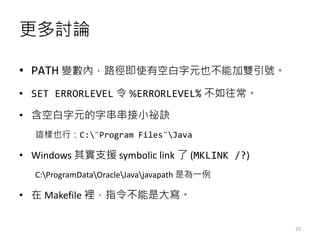
? REM
©C ś╦£╩ū÷Ę©
©C (▀^╚źėą |, >, < Ą─Ž▌┌Õ)
? ::
©C ŲõīŹ╩Ū GOTO ś╦╗`
©C ▓╗─▄╝ėį┌ąą╬▓
19](https://image.slidesharecdn.com/batch-intro-151227121206/85/Batch-19-320.jpg)


More Related Content
What's hot (15)

Batch £ž╣╩/ų¬ą┬
- 2. Ū░čį ? ūŅĮ³ ūįäė╗» š²╚ń╗╚ń▌▒▀MąąĪŻ nuuobuild_2005.bat, copy_testload.bat, Debug_Install.bat, SkinEncrypt.bat, CopySkinEncryptFiles.bat, ĪŁ ? ░č╩┬Ūķę╗╝■╝■īæŽ┬üĒ (│╔ .bat)Ż¼ļŖ─X╠µ─Ńū÷ĪŻ ? ŲõīŹąU¼Ź╦ķČ°╚▒Ę”ęÄätĄ─Ż¼ Į©ūhČÓ▓ķ (/?)ĪóČÓįć (īæąĪ│╠╩Į)Ż¼į┘╚²┤_šJĪŻ ╬ę▓╗ų▒Įė╗ž┤─Ń ė├└²ūė╗ž┤─Ń 2
- 3. ┐éė[ ? @ECHO OFF ? Ė„╩ĮĘ¹╠¢ė├═Š ? Argument/Return ? ūāöĄā╔ą═ ? IF ╚²šą ? FOR ╦─╩Į ? į]ĮŌ ? Block ? Function ? Ųõ╦¹ėæšō ? č▄╔·ķåūx 3
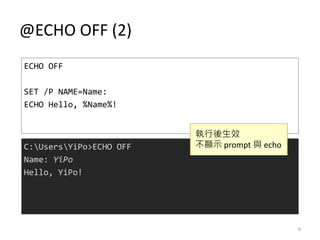
- 4. Hello World (in Batch) SET /P NAME=Name: ECHO Hello, %Name%! C:UsersYiPo>SET /P NAME=Name: Name: YiPo C:UsersYiPo>ECHO Hello, YiPo! Hello, YiPo! šµĄ─Ž±ļŖ─Xį┌ ę╗ąąąąÄ═─Ń▌ö╚ļųĖ┴ŅĪŻ ? ĘĮ▒Ń debug ? Ą½ę▓ėą³cćėÓ┬ ├¹į~Ż║prompt, echo ? SET ŲõīŹ╩ŪįOČ©ŁhŠ│ūāöĄŻ¼ ╚¶╝ė╔Ž /P ┐╔ė╔ stdin ╚ĪĄ├┘Y┴ŽĪŻ ? % üĒ š╣ķ_ ŁhŠ│ūāöĄ (▓╗╩Ū $)ĪŻ 4
- 5. @ECHO OFF (1) @SET /P NAME=Name: @ECHO Hello, %Name%! Name: YiPo Hello, YiPo! ū„ė├ņČįōąą ▓╗’@╩Š prompt ┼c echo 5
- 6. @ECHO OFF (2) ECHO OFF SET /P NAME=Name: ECHO Hello, %Name%! C:UsersYiPo>ECHO OFF Name: YiPo Hello, YiPo! ł╠ąąßß╔·ą¦ ▓╗’@╩Š prompt ┼c echo 6
- 7. @ECHO OFF (3) @ECHO OFF SET /P NAME=Name: ECHO Hello, %Name%! Name: YiPo Hello, YiPo! @ECHO OFF Š═╩Ū▀@śėüĒĄ─ĪŻ (▓╗═¼ņČ bash Ą─ #!/bin/bash 7
- 8. Ę¹╠¢┐éäėåT @ įōąą▓╗ echo % š╣ķ_ūāöĄ ųžą┬ī¦Ž“ < Å─Ön░Ė▌ö╚ļ <&n ▌ö╚ļų┴įō fd > ▌ö│÷ų┴Ön░Ė >&n ▌ö│÷įō fd ų┴ | ╣▄ŠĆ ųĖ┴Ņ┤«Įė & (¤oŚl╝■) ┤«▀BųĖ┴Ņ && Ū░├µ│╔╣”▓┼ł╠ąą || Ū░├µ╩¦öĪ▓┼ł╠ąą () │▓ĀŅųĖ┴Ņ └mąąŻ║^ ╠°├ōūųį¬ ^% ^& ^| ^( ^) ^^ 0: stdin 1: stdout 2: stderr 8
- 9. Input/Output ┼c Argument/Return @ECHO OFF ECHO %0, %* ECHO %1, %2, %3 SHIFT ECHO %1, %2, %3 EXIT /B 56 C:UsersYiPoExample.bat, apple banana cat dog apple, banana, cat banana, cat, dog C:UsersYiPo>Example.bat apple banana cat dog ? %0 ų┴ %9Ż¼ø]ėą %10 įōį§³N▐kŻ┐ ? EXIT ąUļyė├Ą─Ż¼ ¤oĘ©╠°│÷å╬īė batchĪŻ ąĪĄzįEŻ║┐╔ęįė├═Ž└ŁĘĮ╩ĮjÖn░Ė┬ĘÅĮĮo .batĪŻ 9
- 10. ūāöĄā╔ą═ ? %X (ų╗─▄ę╗éĆūųį¬) ©C ųĖ┴ŅģóöĄ (%0-%9)Īó▐Æ╚”ūāöĄ (%A-%Z, %a-%z) ©C %~X (FOR /?) ? %VAR% ©C ŁhŠ│ūāöĄ ©C %VAR:~1,-1% ╗“ %VAR:str1==str2% (SET /?) 10
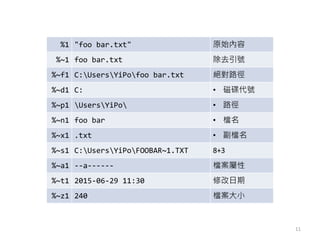
- 11. %1 "foo bar.txt" įŁ╩╝ā╚╚▌ %~1 foo bar.txt │²╚źę²╠¢ %~f1 C:UsersYiPofoo bar.txt Į^ī”┬ĘÅĮ %~d1 C: ? ┤┼Ą·┤·╠¢ %~p1 UsersYiPo ? ┬ĘÅĮ %~n1 foo bar ? Ön├¹ %~x1 .txt ? Ė▒Ön├¹ %~s1 C:UsersYiPoFOOBAR~1.TXT 8+3 %~a1 --a------ Ön░Ėī┘ąį %~t1 2015-06-29 11:30 ą▐Ė─╚šŲ┌ %~z1 240 Ön░Ė┤¾ąĪ 11
- 12. IF ╚²šą ? IF ERRORLEVEL 3 ©C exit code >= 3 ? IF foo == bar ©C Ž▌┌Õ║▄ČÓ ? IF EXIST file ╦∙ęįę¬Å─┤¾Ą─╠¶ĄĮąĪĄ─ĪŻ 12
- 13. Ž▌┌ÕŻ║ąĪą─ ┐šūāöĄ ┼c ┐š░ūūųį¬ (1) SET VAR= IF %VAR% == foo ( ECHO OK ) ▀@éĆĢr║“▓╗æ¬ėą (ĪŻ IF == foo ( SET VAR=foo bar IF _%VAR% == _foo ( ECHO OK ) ▀@éĆĢr║“▓╗æ¬ėą barĪŻ IF _foo bar == _foo ( IF _ == _foo ( IF "foo bar" == foo ( 13
- 14. Ž▌┌ÕŻ║ąĪą─ ┐šūāöĄ ┼c ┐š░ūūųį¬ (2) SET VAR=foo bar IF "%VAR%"=="foo bar" ( ECHO OK ) OK IF "foo bar" == "foo bar" ( SET VAR="foo bar" IF "%VAR%"=="foo bar" ( ECHO OK ) ▀@éĆĢr║“▓╗æ¬ėą bar""=="foo bar"ĪŻ IF ""foo bar""=="foo bar" ( ┐ņ▓╗ąą┴╦ĪŁų╗ėą %~1 ┐╔ęį╚źę²╠¢╦Ń╩Ūš²ĮŌ┴╦ š²š²ĮŌŻ║IF "%~1"=="foo" ( 14
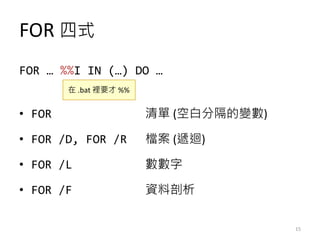
- 15. FOR ╦─╩Į FOR ĪŁ %%I IN (ĪŁ) DO ĪŁ ? FOR ŪÕå╬ (┐š░ūĘųĖ¶Ą─ūāöĄ) ? FOR /D, FOR /R Ön░Ė (▀f▐Æ) ? FOR /L öĄöĄūų ? FOR /F ┘Y┴ŽŲ╩╬÷ į┌ .bat čeę¬▓┼ %% 15
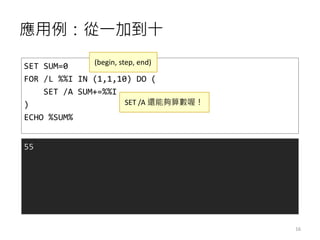
- 16. æ¬ė├└²Ż║Å─ę╗╝ėĄĮ╩« SET SUM=0 FOR /L %%I IN (1,1,10) DO ( SET /A SUM+=%%I ) ECHO %SUM% 55 (begin, step, end) SET /A ▀Ć─▄ē“╦ŃöĄÓĖŻĪ 16
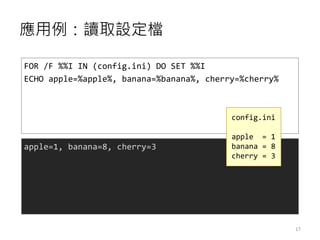
- 17. æ¬ė├└²Ż║ūx╚ĪįOČ©Ön FOR /F %%I IN (config.ini) DO SET %%I ECHO apple=%apple%, banana=%banana%, cherry=%cherry% apple=1, banana=8, cherry=3 config.ini apple = 1 banana = 8 cherry = 3 17
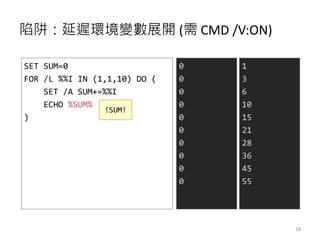
- 18. Ž▌┌ÕŻ║čė▀tŁhŠ│ūāöĄš╣ķ_ (ąĶ CMD /V:ON) SET SUM=0 FOR /L %%I IN (1,1,10) DO ( SET /A SUM+=%%I ECHO %SUM% ) 0 0 0 0 0 0 0 0 0 0 !SUM! 1 3 6 10 15 21 28 36 45 55 18
- 19. į]ĮŌ ? REM ©C ś╦£╩ū÷Ę© ©C (▀^╚źėą |, >, < Ą─Ž▌┌Õ) ? :: ©C ŲõīŹ╩Ū GOTO ś╦╗` ©C ▓╗─▄╝ėį┌ąą╬▓ 19
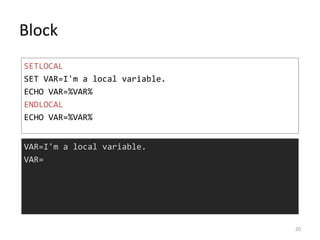
- 20. Block SETLOCAL SET VAR=I'm a local variable. ECHO VAR=%VAR% ENDLOCAL ECHO VAR=%VAR% VAR=I'm a local variable. VAR= 20
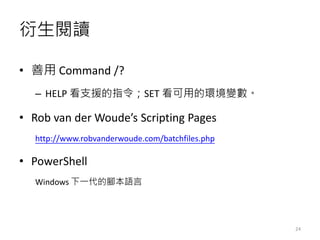
- 21. Function CALL :func apple banana cherry ECHO OK GOTO :EOF :func ECHO %* GOTO :EOF apple banana cherry OK ąĪą─äe└^└m═∙Ž┬ł╠ąą 21
- 22. └¹ė├ę╗Ž┬ PATH ┼c CD 22 SET TARGET_PATH=D:TestloadODMDlink... %TOOLS_PATH%CabArc.exe %TARGET_PATH%file1 ... %TOOLS_PATH%NuGuidPatch.exe %TARGET_PATH%file2 ... %TOOLS_PATH%SkinEncrypt.exe %TARGET_PATH%file3 ... CD /D %~dp0 PATH tools CabArc file1 ... NuGuidPatch file2 ... SkinEncrypt file3 ... ╩╣ė├Ū░Č╝ę¬╩ųäėĖ─▀@ąą ║▄ķLę╗┤«Ż¼▓╗ęūķåūxĪŻ
- 23. Ė³ČÓėæšō ? PATH ūāöĄā╚Ż¼┬ĘÅĮ╝┤╩╣ėą┐š░ūūųį¬ę▓▓╗─▄╝ėļpę²╠¢ĪŻ ? SET ERRORLEVEL ┴Ņ %ERRORLEVEL% ▓╗╚ń═∙│ŻĪŻ ? ║¼┐š░ūūųį¬Ą─ūų┤«┤«ĮėąĪĄzįE ▀@śėę▓ąąŻ║C:"Program Files"Java ? Windows ŲõīŹų¦į« symbolic link ┴╦ (MKLINK /?) C:ProgramDataOracleJavajavapath ╩Ū×ķę╗└² ? į┌ Makefile čeŻ¼ųĖ┴Ņ▓╗─▄╩Ū┤¾īæĪŻ 23
- 24. č▄╔·ķåūx ? ╔Ųė├ Command /? ©C HELP ┐┤ų¦į«Ą─ųĖ┴ŅŻ╗SET ┐┤┐╔ė├Ą─ŁhŠ│ūāöĄĪŻ ? Rob van der WoudeĪ»s Scripting Pages http://www.robvanderwoude.com/batchfiles.php ? PowerShell Windows Ž┬ę╗┤·Ą──_▒ŠšZčį 24