


More Related Content
Viewers also liked (16)
Similar to Big Data Project using HIVE - college scorecard (20)
![[DSC DACH 23] The Modern Data Stack - Bogdan Pirvu](https://cdn.slidesharecdn.com/ss_thumbnails/moderndatastack-tutorialslidesforprint-230424133634-bb9133d0-thumbnail.jpg?width=560&fit=bounds)


Recently uploaded (20)


![SketchUp Pro Crack [2025]-Free Download?](https://cdn.slidesharecdn.com/ss_thumbnails/tighteningeverybolt-fosdem2025-250224092147-cc175839-250305114942-10710f44-thumbnail.jpg?width=560&fit=bounds)


Big Data Project using HIVE - college scorecard
- 1. COLLEGE SCORECARD ANALYSIS USING HIVE Presented By: Abhishek Kumar Anurag Anand Aditya Patil Siva Sai
- 2. TABLE OF CONTENT ŌĆó What is BigData ŌĆó College Scorecard ŌĆó What is our Project ŌĆó What technology we used ŌĆó SDLC ŌĆó Hive Queries ŌĆó Graphs and Final Results ŌĆó Conclusion ŌĆó Github and Data Source ŌĆó References
- 3. BIG DATA IN AROUND THE WORLD
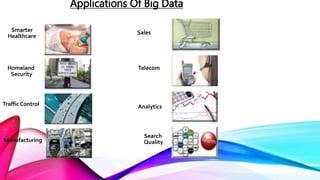
- 5. A Applications Of Big Data Homeland Security Smarter Healthcare Sales Telecom Manufacturing Traffic Control Analytics Search Quality
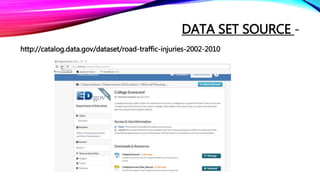
- 6. DATA SET SOURCE - http://catalog.data.gov/dataset/road-traffic-injuries-2002-2010
- 7. THE RAW DATA
- 8. COLLEGE SCORECARDS MAKE IT EASIER FOR STUDENTS TO SEARCH FOR A COLLEGE THAT IS A GOOD FIT FOR THEM. THEY CAN USE THE COLLEGE SCORECARD TO FIND OUT ŌĆó Popular Colleges among students ŌĆó Affordability ŌĆó Net Price ŌĆó No of enrollments ŌĆó State with Most number of University
- 9. TECHNOLOGIES WHAT HAVE WE USED ŌĆó Microsoft Power BI ŌĆó Apache Ambari - Version 2.1.2 ŌĆó Hortonworks Sandbox with HDP 2.4 ŌĆó HIVE ŌĆó Microsoft Excel ŌĆó Putty - Release 0.65 ŌĆó Google Fusion Table
- 10. SYSTEM DEVELOPMENT LIFE CYCLE
- 11. SYSTEM DEVELOPMENT LIFE CYCLE Planning ŌĆó Defined Scope ŌĆó Requirement Gathering ŌĆó Time Estimation Analysis ŌĆó Gathered data from Data.Gov Design ŌĆó Gathered required softwares such as Azure, Power View, Microsoft Power BI Impleme ntation ŌĆó Developed Queries & Created Tables Testing ŌĆó Analysis made on the created Tables using graph and Map
- 12. WHAT IS OUR PROJECT ŌĆó Data analysis is done on College Student Data ’āśCost of college Tution Fee ’āśAdmission Rate ’āśPopular Colleges ’āśPopular States ’āśBiggest Universities ŌĆó Data analysis is done by using HDFS Cluster, HiveQL ŌĆó Analyzed data will be displayed using MS Power BI & Power Query in the form of Graphs and Maps.
- 13. CREATING THE CLUSTER IN SANDBOX
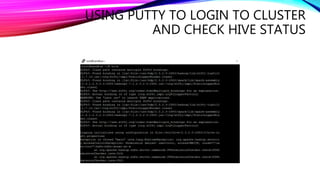
- 14. USING PUTTY TO LOGIN TO CLUSTER AND CHECK HIVE STATUS
- 15. PROCESS OF ANALYSIS Step 1- Data CLEANING by removing unwanted an NULL column. Step-2- LOADING Data to HDFS STEP-3- Running HQL Queries Steo-4-Saving results in CVS files Step-5- Combining the results into one Excel file. Step-6- Analyzing data through Power BI & EXCEL.
- 16. FLOWCHART OF DATA ANALYSIS DOWNLOAD DATA FROM DATA.GOV Uploaded the txt files into HDFS Using Ambari Created tables using HiveQL Analysed data using the query, Microsoft BI and powerview Analysis of Bar and line Graphs.
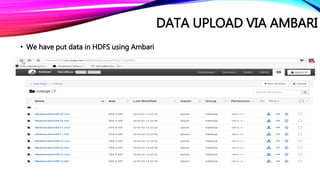
- 17. DATA UPLOAD VIA AMBARI ŌĆó We have put data in HDFS using Ambari
- 19. CREATING A COST TABLE ŌĆó CREATE TABLE newcost2011( ŌĆó UNITID INT, INSTNM STRING,CITY STRING,CONTROL INT,ADM_RATE FLOAT,ADM_RATE_ALL FLOAT,TUITFTE FLOAT,TUITIONFEE_IN FLOAT,TUITIONFEE_OUT FLOAT,COSTT4_A FLOAT, UGDS INT) ŌĆó COMMENT 'This is the Student 2011 data' ŌĆó ROW FORMAT DELIMITED ŌĆó FIELDS TERMINATED BY 't' ŌĆó STORED AS TEXTFILE; ŌĆó LOAD DATA INPATH '/tmp/newcost2011.txt' OVERWRITE INTO TABLE newcost2011;
- 20. OUTPUT OF QUERY
- 21. RESULTS OF THE QUERY
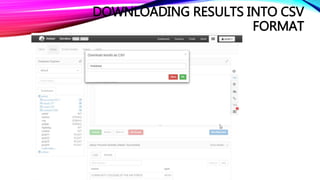
- 22. DOWNLOADING RESULTS INTO CSV FORMAT
- 23. HIVE QUERY FOR SORTING DATA
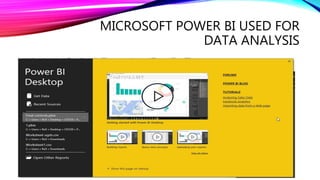
- 24. MICROSOFT POWER BI USED FOR DATA ANALYSIS
- 25. COMBINING THE RESULT QUERY TOGETHER FOR ANALYSIS
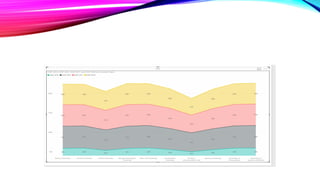
- 26. GRAPHICAL REPRESENTATION USING POWER BI
- 27. GRAPHICAL REPRESENTATION USING POWERVIEW
- 28. GRAPHICAL REPRESENTATION USING GOOGLE FUSION TABLES
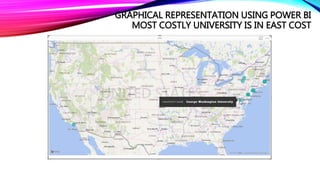
- 30. GRAPHICAL REPRESENTATION USING POWER BI MOST COSTLY UNIVERSITY IS IN EAST COST
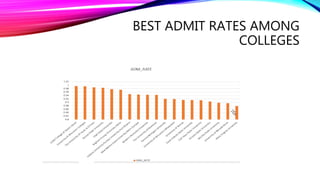
- 32. BEST ADMIT RATES AMONG COLLEGES
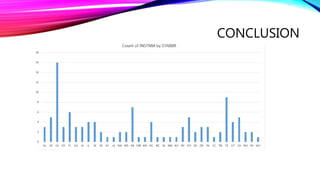
- 33. CONCLUSION
- 34. SATE WITH HIGHEST NUMBER OF UNIVERSITY
- 35. MOST POPULAR COLLEGE MAJORS
- 36. CONCLUSION ŌĆó COSTLIET UNIVERSITY is NEW YORK UNIVERSITY ŌĆó Most of costly university are located in east cost i.e New York and nearby area ŌĆó BIGGEST UNIVERSITY of Phoenix-Online Campus ŌĆó Biggest Major Is business. ŌĆó STATE WITH MOST UNIVERSITY WITH 10000 student is California i.e 16 ŌĆó CUNY College of Staten Island has highest admission rate i.e. its easiet to get admission here. ŌĆó CHEAPEST College is High Point University
- 37. LINK ŌĆó GITHUB Link: (Code Only) https://github.com/abhimisedu/CIS520GroupF ŌĆó Dataset Link: (Dataset Size ŌĆō 1580 MB uncompressed) http://catalog.data.gov/dataset/college-scorecard
- 38. REFERENCE ŌĆó https://azure.microsoft.com ŌĆó www.Data.gov ŌĆó http://www.lynda.com/Hadoop-tutorials/ ŌĆó http://www.tutorialspoint.com/big_data_tutorials.htm ŌĆó http://searchstorage.techtarget.com/guides/Big-data-tutorial-Everything-you-need- to-know