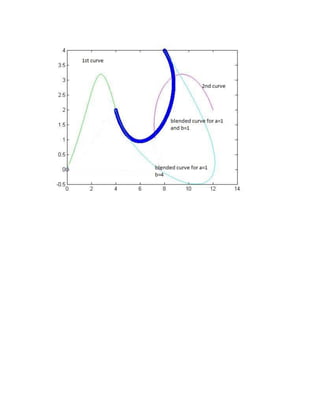
Blending of hermite curves
- 1. Object- to blend two hermite curves clear all clc G1=[0 ; 4 ;7 ;5 ] G2=[0;2;7;-8] M=[2 -2 1 1;-3 3 -2 -1;0 0 1 0;1 0 0 0] i=1 for u=0:0.001:1 U=[u^3 u^2 u 1] i=i+1; x1(i)=U*M*G1 y1(i)=U*M*G2 end G3=[8 ; 12 ;-8 ;7] G4=[4;6;5;-7] for u=0:0.001:1 U=[u^3 u^2 u 1] i=i+1; x2(i)=U*M*G3 y2(i)=U*M*G2 end G5=[4 ;8 ;5 ;-8] G6=[2;4;-8;5] for u=0:0.001:1 U=[u^3 u^2 u 1] i=i+1; x3(i)=U*M*G5 y3(i)=U*M*G6 end G7=[4 ;8 ;5 ;-32] G8=[2;4;-8;20] for u=0:0.001:1 U=[u^3 u^2 u 1] i=i+1; x4(i)=U*M*G7 y4(i)=U*M*G8 end plot(x1,y1,'g') hold on plot(x2,y2,'M') plot(x3,y3,'o') plot(x4,y4,'c') plot(x3,y3,'o')

![Object- to blend two hermite curves
clear all
clc
G1=[0 ; 4 ;7 ;5 ]
G2=[0;2;7;-8]
M=[2 -2 1 1;-3 3 -2 -1;0 0 1 0;1 0 0 0]
i=1
for u=0:0.001:1
U=[u^3 u^2 u 1]
i=i+1;
x1(i)=U*M*G1
y1(i)=U*M*G2
end
G3=[8 ; 12 ;-8 ;7]
G4=[4;6;5;-7]
for u=0:0.001:1
U=[u^3 u^2 u 1]
i=i+1;
x2(i)=U*M*G3
y2(i)=U*M*G2
end
G5=[4 ;8 ;5 ;-8]
G6=[2;4;-8;5]
for u=0:0.001:1
U=[u^3 u^2 u 1]
i=i+1;
x3(i)=U*M*G5
y3(i)=U*M*G6
end
G7=[4 ;8 ;5 ;-32]
G8=[2;4;-8;20]
for u=0:0.001:1
U=[u^3 u^2 u 1]
i=i+1;
x4(i)=U*M*G7
y4(i)=U*M*G8
end
plot(x1,y1,'g')
hold on
plot(x2,y2,'M')
plot(x3,y3,'o')
plot(x4,y4,'c')
plot(x3,y3,'o')](https://image.slidesharecdn.com/blendingofhermitecurves-converted-200411202406/85/Blending-of-hermite-curves-1-320.jpg)
