Boston Population
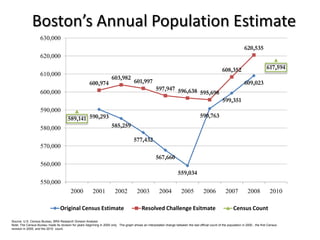
- 1. Boston’s Annual Population Estimate 630,000 620,535 620,000 608,352 617,594 610,000 603,982 600,974 601,997 609,023 597,947 596,638 600,000 595,698 599,351 590,000 589,141 590,293 590,763 580,000 585,259 577,432 570,000 567,660 560,000 559,034 550,000 2000 2001 2002 2003 2004 2005 2006 2007 2008 2010 Original Census Estimate Resolved Challenge Esitmate Census Count Source: U.S. Census Bureau; BRA Research Division Analysis Note: The Census Bureau made its revision for years beginning in 2005 only. The graph shows an interpolated change between the last official count of the population in 2000 , the first Census revision in 2005, and the 2010 count.
