Business Analytics Foundation with R Tools Part 1
- 1. BUSINESS ANALYTICS FOUNDATION WITH R TOOLS Lesson 4 - Predictive Modeling Techniques Part 1 Copyright 2016,Beamsync, All rights reserved.
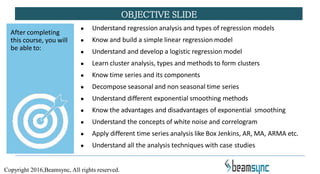
- 2. ŌŚÅ Understand regression analysis and types of regression models ŌŚÅ Know and build a simple linear regression model ŌŚÅ Understand and develop a logistic regression model ŌŚÅ Learn cluster analysis, types and methods to form clusters ŌŚÅ Know time series and its components ŌŚÅ Decompose seasonal and non seasonal time series ŌŚÅ Understand different exponential smoothing methods ŌŚÅ Know the advantages and disadvantages of exponential smoothing ŌŚÅ Understand the concepts of white noise and correlogram ŌŚÅ Apply different time series analysis like Box Jenkins, AR, MA, ARMA etc. ŌŚÅ Understand all the analysis techniques with case studies OBJECTIVE SLIDE After completing this course, you will be able to: Copyright 2016,Beamsync, All rights reserved.
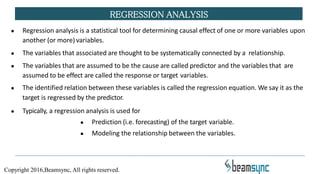
- 3. REGRESSION ANALYSIS ŌŚÅ Regression analysis is a statistical tool for determining causal effect of one or more variables upon another (or more) variables. ŌŚÅ The variables that associated are thought to be systematically connected by a relationship. ŌŚÅ The variables that are assumed to be the cause are called predictor and the variables that are assumed to be effect are called the response or target variables. ŌŚÅ The identified relation between these variables is called the regression equation. We say it as the target is regressed by the predictor. ŌŚÅ Typically, a regression analysis is used for ŌŚÅ Prediction (i.e. forecasting) of the target variable. ŌŚÅ Modeling the relationship between the variables. Copyright 2016,Beamsync, All rights reserved.
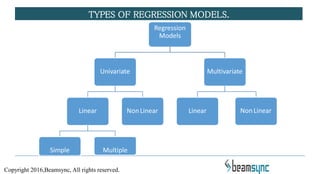
- 4. TYPES OF REGRESSION MODELS. Regression Models Univariate Linear Simple Multiple NonLinear Multivariate Linear NonLinear Copyright 2016,Beamsync, All rights reserved.
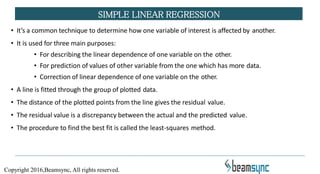
- 5. ŌĆó ItŌĆÖs a common technique to determine how one variable of interest is affected by another. ŌĆó It is used for three main purposes: ŌĆó For describing the linear dependence of one variable on the other. ŌĆó For prediction of values of other variable from the one which has more data. ŌĆó Correction of linear dependence of one variable on the other. ŌĆó A line is fitted through the group of plotted data. ŌĆó The distance of the plotted points from the line gives the residual value. ŌĆó The residual value is a discrepancy between the actual and the predicted value. ŌĆó The procedure to find the best fit is called the least-squares method. SIMPLE LINEAR REGRESSION Copyright 2016,Beamsync, All rights reserved.
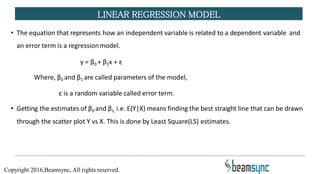
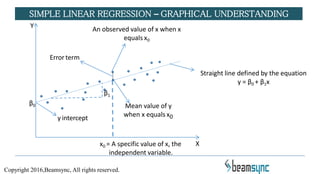
- 6. ŌĆó The equation that represents how an independent variable is related to a dependent variable and an error term is a regressionmodel. y = ╬▓0 + ╬▓1x + ╬Ą Where, ╬▓0 and ╬▓1 are called parameters of the model, ╬Ą is a random variable called error term. ŌĆó Getting the estimates of ╬▓0 and ╬▓1, i.e. E(Y|X) means finding the best straight line that can be drawn through the scatter plot Y vs X. This is done by Least Square(LS) estimates. LINEAR REGRESSION MODEL Copyright 2016,Beamsync, All rights reserved.
- 7. SIMPLE LINEAR REGRESSION ŌĆō GRAPHICAL UNDERSTANDING y intercept An observed value of x when x equals x0 Mean value of y when x equals x0 X Y x0 = A specific value of x, the independent variable. ╬▓0 Error term Straight line defined by the equation y = ╬▓0 + ╬▓1x ╬▓1 Copyright 2016,Beamsync, All rights reserved.
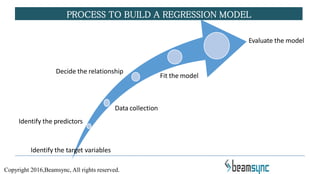
- 8. PROCESS TO BUILD A REGRESSION MODEL Evaluate the model Identify the target variables Identify the predictors Data collection Decide the relationship Fit the model Copyright 2016,Beamsync, All rights reserved.
- 9. ŌĆó The predictor variable x is non ŌĆō random. ŌĆó The error term ╬Ą is random. ŌĆó Error term follows normal distribution. ŌĆó Standard deviation of error is independent of x. ŌĆó The data being used to estimate the parameters should be independent of each other. ŌĆó If any of the above assumptions are violated, modelling procedure must be modified. LINEAR REGRESSION MODEL ASSUMPTIONS Copyright 2016,Beamsync, All rights reserved.
- 10. Thank You Beamsync is providing business analytics training in Bangalore along with R tool. If you are looking your career into analytics schedule youŌĆÖre training here: http://beamsync.com/business-analytics-training-bangalore/ Copyright 2016,Beamsync, All rights reserved.

