Business Application of Conjoint analysis
- 1. Index INTRODUCTION OF CONJOINT ANALYSIS Definitions and goals Parametric Conjoint Approaches Nonparametric approaches Permutation method Parametric bootstrap Outcomes and Shortcomings Average Marginal Component Effect
- 2. Marketing Strategy Market Share Estimation -0.4 -0.3 -0.2 -0.1 0 0.1 0.2 0.3 0.4 EstimŌĆ” 0 10,000 20,000 30,000 Year 0 Year 1 Year 2 Sales forecasting Conjoint Analysis Applications Partial-worths Estimation CCDVTP ŌĆ£Create, Communicate, Deliver the Value to the Target market at a ProfitŌĆØ Philip Kotler VALUE CLIENTS ? PRODUCT PROFITS ? How do custumers perceive the value we create?
- 3. Parametric Conjoint Analysis applied to a new patent Anti-theft patent for bicycles Rating marketing experiment applied to a company interested in evaluating his patent: an anti-theft product for bike with an innovative characteristic was developed. Full integrated Integration: it is a characteristic that keeps the GPS device safe from the burglar 3 attributes were taken into account: External/camouflaged External/visible Difficult, technician needed Maintenance/installation, this is a characteristic about charging the battery with three levels: Difficult, no technician needed Easy Sound alarm, presence of sound alarm with two levels: Yes ŌĆō the alarm is present No ŌĆō the alarm is not present The goal: to figure out if a full integration and the insertion of an alarm could be a competitive advantage that allowed to get a higher market share. Types of integrations:
- 4. Application of Conjoint Analysis to a new patent Outcomes- Partial worths - Importance 1.22 0.30 -1.52 -0.77 -0.12 0.89 0.48 -0.48 1.18 0.33 -1.50 -0.65 -0.10 0.75 0.49 -0.49 -2 -1.5 -1 -0.5 0 0.5 1 1.5 Integ Est-inv Est-vis Complex-tec Complex-noTec Easy Yes No Partial worths utilities Whole sample Residuals: Min 1Q Median 3Q Max -5,6375 -0,7617 0,2117 0,7805 4,2156 Coefficients: Estimate Std. Error t value Pr(>|t|) (Intercept) 6,05156 0,06942 87,170 < 2e-16 factor(Integration/invisibility)1 1,17682 0,08503 13,841 < 2e-16 factor(Integration/invisibility)2 0,32760 0,09350 3,504 0,000495 factor(Easy maintenance/installation)1 -0,64635 0,08063 -8,017 6,19e-15 factor(Easy.maintenance/installation)2 -0,10417 0,10587 -0,984 0,325571 factor(Sound.alarm)1 0,48672 0,07449 6,534 1,42e-10 Residual standard error: 1,392 on 570 degrees of freedom Multiple R-squared: 0.3872, Adjusted R-squared: 0.3818 F-statistic: 72.02 on 5 and 570 DF, p-value: < 2,2e-16
- 5. Application of Conjoint Analysis to a new patent Outcomes ŌĆō Market Share Rocket 26% Nigiloc 10%Spybike S. 26% Lock8 10% The Cricket 13% Coban 15% LogitModel - Rocket without alarm Rocket 48% Nigiloc 7% Spybike S. 19% Lock8 4% The Cricket 10% Coban 12% LogitModel - Rocket with alarm Total Utility Max Model BTL Model Logit Model Rocket without alarm 7,51 28,125 18,62 25,98 Nigiloc 6,11 3,12 15,19 9,77 Spybike Seatpost 7,51 28,13 18,62 25,98 Lock8 5,8 15,62 14,56 10,38 The Cricket 6,66 6,25 16,52 12,74 Coban 6,67 18,75 16,5 15,16 Product Total Utility Max Model BTL Model Logit Model Rocket with alarm 8,50 84,38 21,13 47,71 Nigiloc 6,11 0,00 15,19 7,45 Spybike Seatpost 7,51 4,69 18,58 19,00 Lock8 4,82 3,12 12,02 4,22 The Cricket 6,66 3,12 16,56 9,83 Coban 6,67 4,69 16,52 11,79
- 6. Procedure to estimate Product Demand Italian Potential market Survey Analysis Target market Statistic methods Optimistic Scenario Pessimistic Scenario Sales Sales during the first 3 years Logistic index Market Share Conjoint analysis 0 5,000 10,000 15,000 20,000 25,000 Year 0 Year 1 Year 2 1.291 4.519 6.456 4.030 14.106 20.152 Sales Sales during the first 3 years Sales - Worst case scenario Sales - Best case scenario
- 7. Limits of previous procedure Assumptions and diagnostics ŌĆ£When the assumptions are not met the results may not be trustworthy, resulting in a Type I or Type II error, or over- or under-estimation of significance or effect size(s)ŌĆØ. Osborne, Jason & Elaine Waters , North Carolina State University and University of Oklahoma This is confirmed by the following diagnostic procedure Data indicate the assumptions of normality and homoschedasticity may be violated.
- 8. NonParametric methods Permutation method Run regression by respondents and store the obtained estimates This approach requires a more relaxed assumption that is exchangeability. ØøĮ11 ØøĮ12 ŌĆ” ØøĮ1ØæÜ(ØæÖŌłÆ1) ØøĮ21 ØøĮ22 ŌĆ” ØøĮ2ØæÜ(ØæÖŌłÆ1) ŌĆ” ØøĮ Øæø1 ØøĮ Øæø1 ŌĆ” ØøĮ ØæøØæÜ(ØæÖŌłÆ1) Perform a sign or signed-rank test, where for each alternatives the hypothesis are: ØÉ╗0 : ╬▓=0 ØÉ╗1 : ╬▓ŌēĀ0 (Intercept) Full-integ External- Camouflaged Complex- technician Complex-no- technician Sound- alarm-yes Sign Test 0.00e-16 0.00e-16 2,26E-10 7,05E-12 1,562E-03 4,74E-09 Wilcoxon 3,61E-06 3,78E-06 6,98E-06 4,16E-06 1,18E-02 6,66E-06 P values "Permutation tests for between-unit fixed effects in multivariate generalized linear mixed models, FinosŌĆØ(2014)
- 9. NonParametric methods Market share ŌĆō Parametric bootstrap In order to add the uncertainty into the model we have run a simulation in which, for each loop, the beta vector is computed by taking into account the estimates and the standard errors of the betas. ØæīØæ¢,ØæŚ,ØæĀ = ╬▓Øæ¢ØæøØæĪ,ØæōØæóØæÖØæÖ,ØæĀ ØæżØæ¢ØæøØæĪ,ØæōØæóØæÖØæÖ + ╬▓Øæ¢ØæøØæĪ,ØæōØæóØæÖØæÖ,ØæĀ ØæżØæ¢ØæøØæĪ,ØæÆØæźØæĪŌłÆØæ¢ØæøØæŻ + Ōŗ» + Ø£ĆØæ¢ØæŚØæĀ Rating for product j and respondent i in simulation s Dummy variable: 0 or 1 Normal distribution which the estimate for each loop will be extracted from ╬╝=╬▓attr,level Žā =Øæå. ØÉĖ.╬▓attr,level Normal distribution from which the rumor for each respondent and product, for each loop will be extracted ╬╝= Øæź Øæ¤ØæÆØæĀØæ¢ØææØæóØæÄØæÖ Žā = ØæĀ. Øææ. Øæ¤ØæÆØæĀØæ¢ØææØæóØæÄØæÖ Calculate for each simulation the MKS of the products
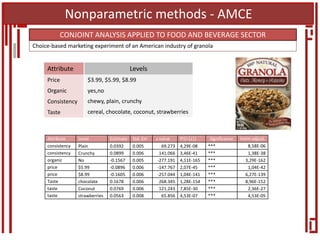
- 10. Nonparametric methods - AMCE CONJOINT ANALYSIS APPLIED TO FOOD AND BEVERAGE SECTOR Attribute Level Estimate Std. Err z value Pr(>|z|) Significance Holm adjust. consistency Plain 0.0392 0.005 69.273 4,29E-08 *** 8,58E-06 consistency Crunchy 0.0899 0.006 141.066 3,46E-41 *** 1,38E-38 organic No -0.1567 0.005 -277.191 4,11E-165 *** 3,29E-162 price $5.99 -0.0896 0.006 -147.767 2,07E-45 *** 1,04E-42 price $8.99 -0.1605 0.006 -257.044 1,04E-141 *** 6,27E-139 Taste chocolate 0.1678 0.006 268.345 1,28E-154 *** 8,96E-152 taste Coconut 0.0769 0.006 121.243 7,85E-30 *** 2,36E-27 taste strawberries 0.0563 0.008 65.856 4,53E-07 *** 4,53E-05 Choice-based marketing experiment of an American industry of granola Price $3.99, $5.99, $8.99 Organic yes,no Consistency chewy, plain, crunchy Taste cereal, chocolate, coconut, strawberries Attribute Levels
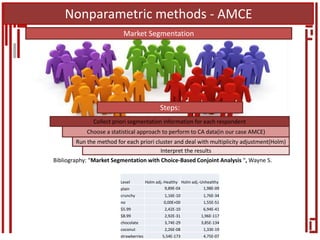
- 11. Nonparametric methods - AMCE Market Segmentation Steps: Collect priori segmentation information for each respondent Choose a statistical approach to perform to CA data(in our case AMCE) Run the method for each priori cluster and deal with multiplicity adjustment(Holm) Interpret the results Level Holm adj.-Healthy Holm adj.-Unhealthy plain 9,89E-04 1,98E-09 crunchy 1,16E-10 1,76E-34 no 0,00E+00 1,55E-51 $5.99 2,42E-10 6,94E-41 $8.99 2,92E-31 1,96E-117 chocolate 3,74E-29 3,85E-134 coconut 2,26E-08 1,33E-19 strawberries 5,54E-173 4,75E-07 Bibliography: ŌĆ£Market Segmentation with Choice-Based Conjoint Analysis ŌĆ£, Wayne S.
- 12. Other applications - Pricing 7.50 8.00 8.50 9.00 9.50 10.00 10.50 0.00% 5.00% 10.00% 15.00% 20.00% 25.00% 30.00% 35.00% 40.00% 3.99 4.29 4.59 4.89 5.19 5.49 5.79 6.09 6.39 6.69 6.99 7.29 7.59 7.89 8.19 8.49 8.79 Revenue(Millions$) MarketShare Price of our product ($) Market Share VS Price MKS comp1 MKS comp2 MKS comp3 MKS Our- prod Our Revenue 31.97% 27.47% 24.29% 16.27%17.10% 54.53% 10.18% 18.18% 0.00% 10.00% 20.00% 30.00% 40.00% 50.00% 60.00% comp1 comp2 comp3 Our-prod MKS old version /MKS new version MKS MKS - new feature Price as continous variable Our Revenue: MKS x Price x Target market 10 000 000 Our old product version Price Organic Consistency Taste 5,99no chewy strawberries Our new product version Price Organic Consistency Taste 5,99yes crunchy strawberries
- 13. Other applications - Pricing 15% 16% 16% 17% 17% 18% 18% 19% 5.99 6.04 6.09 6.14 6.19 6.24 6.29 6.34 6.39 6.44 6.49 6.54 6.59 6.64 6.69 6.74 6.79 6.84 6.89 Price ($) MKS - Our new product MKS - Our new product MKS of the product with new features MKS of the product with old features
- 14. Suggested approach Finally we try to provide a best practice guideline for a Conjoint Analysis experiment Holm adjstment for Multiplicity Collect data from respondents using profiles with a rondomized design Choice-based CA with AMCE or Mnlogit model Market Share Tools or service Procedures Cost for each response: 99c Opensource Software Opensource Software -0.4 -0.2 0 0.2 0.4 Partial-worths EstimŌĆ” 0 10,000 20,000 30,000 Year 0 Year 1 Year 2 Sales forecasting B2B B2C Who use R? www.revolutionanalytics.com/companies-using-r
Editor's Notes
- #3: This is the mantra of marketing proposed by Philip Kotler. The problem is what values do we have to produce, how do we deal with the heterogeneous clientsŌĆÖ preferences, and mainly how does custumers perceive the value we deliver and want to communicate? The difference between what a┬Ācustomer┬Āgets from a┬Āproduct, and what he or she has to give in┬Āorder┬Āto get it
- #16: Value-based pricing - Pricing a product based on the value the product has for the customer and not on its costs of production or any other factor.Price sensitivity is also important to determine how much more may be charged for a product or service by offering a new feature without any net loss in market acceptance.
- #17: Price sensitivity is also important to determine how much more may be charged for a product or service by offering a new feature without any net loss in market acceptance. new price can be charged while maintaining the same share of preference considering also the competitorsŌĆÖ products


