ºÝºÝߣ

ºÝºÝߣShare a Scribd company logo
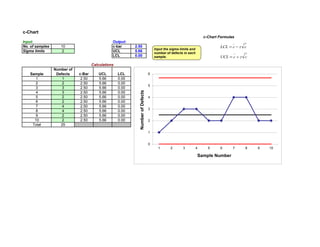
c-Chart
c-Chart Formulas
Output:
No. of samples 10 c-bar 2.50
Sigma limits 2 UCL 5.66
LCL 0.00
Number of
Sample Defects c-Bar UCL LCL
1 1 2.50 5.66 0.00
2 2 2.50 5.66 0.00
3 3 2.50 5.66 0.00
4 3 2.50 5.66 0.00
5 2 2.50 5.66 0.00
6 2 2.50 5.66 0.00
7 4 2.50 5.66 0.00
8 4 2.50 5.66 0.00
9 2 2.50 5.66 0.00
10 2 2.50 5.66 0.00
Total 25
Calculations
Input:
0
1
2
3
4
5
6
1 2 3 4 5 6 7 8 9 10
Number
of
Defects
Sample Number
Input the sigma limits and
number of defects in each
sample. UCL c z c
 
LCL c z c
 
More Related Content

C chart

  • 1. c-Chart c-Chart Formulas Output: No. of samples 10 c-bar 2.50 Sigma limits 2 UCL 5.66 LCL 0.00 Number of Sample Defects c-Bar UCL LCL 1 1 2.50 5.66 0.00 2 2 2.50 5.66 0.00 3 3 2.50 5.66 0.00 4 3 2.50 5.66 0.00 5 2 2.50 5.66 0.00 6 2 2.50 5.66 0.00 7 4 2.50 5.66 0.00 8 4 2.50 5.66 0.00 9 2 2.50 5.66 0.00 10 2 2.50 5.66 0.00 Total 25 Calculations Input: 0 1 2 3 4 5 6 1 2 3 4 5 6 7 8 9 10 Number of Defects Sample Number Input the sigma limits and number of defects in each sample. UCL c z c   LCL c z c  