This document breaks down the components of a METAR weather report, explaining what each element means. It identifies the station, date, time, weather conditions like wind, visibility, sky conditions, temperature and dew point, altimeter setting, and optional remarks. METARs are the standard way to access weather information on the VATSIM virtual air traffic control network, so understanding these reports is important for pilots to know conditions and plan safe flights.
This document provides guidance on how to decode METAR and TAF reports using the International Civil Aviation Organization (ICAO) format. It explains the components of both reports, including location, time, wind, visibility, weather, clouds, and other elements. Key terms that indicate changes in time periods for TAF forecasts are highlighted. Differences between U.S. and international METAR/TAF formats are also outlined. The document is intended to help aviation enthusiasts and pilots better understand weather information in the standardized codes.
The document discusses wind farm analysis workflows and their impact on radar systems. It describes analyzing various wind farm sites from 2003 onward for effects on primary surveillance radar, secondary surveillance radar, VOR systems, and ILS. Methods are discussed for evaluating wind farms' effects on bearing errors, false targets, signal loss, and corruption. The document also outlines Eurocontrol guidelines and regulatory documents on assessing wind turbine impacts and potential mitigation techniques.
This document provides a list of abbreviations and acronyms used in METAR and TAF reports with definitions. It includes over 100 meteorological terms abbreviated for weather observations, such as types of clouds, weather phenomena, visibility, wind and sky conditions in 3 sentences or less.
This document provides an overview of various weather reports and forecasts that are used for multiengine commercial aviation. It includes summaries of printed weather reports like METARs and forecasts, as well as basic weather theory, cloud and weather patterns, hazards like thunderstorms and icing, and the forecasting process.
1. The document describes various features found on aeronautical charts including airways, intersections, reporting points, navigational aids, altitude restrictions, and airport information. It explains how to identify different chart symbols and extract important details like frequencies, distances, and procedures. Key aspects covered are airway segments, minimum enroute/obstruction clearance altitudes, off-route altitudes, and using navigational aids to determine position or switch between routes.
AVS 3201 Hodograph AssignmentSpring 2020Read through the L.docxjasoninnes20
油
The document provides instructions for a hodograph assignment involving plotting wind data on a hodograph diagram. Students are asked to read about hodographs from assigned sources and plot wind direction and speed data from multiple pressure levels on a hodograph sheet provided in class. The basic method is to plot each wind vector as a dot and connect the dots, labeling each with the corresponding pressure value.
AVS 3201 Hodograph AssignmentSpring 2020Read through the L.docxcelenarouzie
油
AVS 3201 Hodograph Assignment
Spring 2020
Read through the Lecture AVS3201_HODOGRAPHS_AUG2019
Also Read Hodograph Basics in Practical Meteorology (section 14.5.1) on pages 510 through 513.
Also Read Advanced Topic: Hodographs in Severe and Hazardous Weather (page 30).
The basic method of plotting the hodograph is two steps:
揃 Plot the tip of each wind vector as a dot.
揃 Connect the dots.
Additionally, label each dot with a value indicating the pressure.
You will use the data handed out to you in class plot the data on your Hodograph sheet handed out in class. You only need to focus on the DRCT (wind direction) and SKNT (wind speed) columns for plotting the hodograph points. Use the PRES (pressure) column to label each point. Using knots for the wind speed is fine. Plot and label the points, then connect the dots!
Your data looks similar to this:
-----------------------------------------------------------------------------
PRES HGHT TEMP DWPT RELH MIXR DRCT SKNT THTA THTE THTV
hPa m C C % g/kg deg knot K K K
-----------------------------------------------------------------------------
980.0 178 23.8 18.8 74 14.14 190 9 298.7 340.0 301.2
965.0 312 22.6 16.6 69 12.46 196 13 298.8 335.3 301.0
932.2 610 19.8 15.1 74 11.73 210 21 298.9 333.4 301.0
925.0 677 19.2 14.8 76 11.57 210 23 298.9 332.9 301.0
899.8 914 17.3 13.7 79 11.05 215 30 299.4 331.9 301.4
898.0 931 17.2 13.6 79 11.01 216 31 299.4 331.9 301.4
868.2 1219 15.5 11.0 75 9.59 230 41 300.5 329.0 302.3
850.0 1399 14.4 9.4 72 8.78 235 42 301.2 327.4 302.8
Etc.
But dont plot all the data! Plot the levels that are the closest to these pressure levels:
1000.0 mb
925.0 mb
875.0 mb
850.0 mb
825.0 mb
800.0 mb
750.0 mb
700.0 mb
650.0 mb
600.0 mb
550.0 mb
500.0 mb
400.0 mb
MU
M鐃
xO
SM
鐃z
MV
M鐃
xO
TM
鐃z
MT
M鐃
xO
RM
鐃z
NM
M鐃
xO
UM
鐃z
NN
M鐃
xO
VM
鐃z
NO
M鐃
xP
MM
鐃z
NP
M鐃
xP
NM
鐃z
NQ
M鐃
xP
OM
鐃z
NR
M鐃
xP
PM
鐃z
NS
M鐃
xP
QM
鐃z
NT
M鐃
xP
RM
鐃z
NU
M鐃
xM
MM
鐃z
NV
M鐃
xM
NM
鐃z
OM
M鐃
xM
OM
鐃z
ON
M鐃
xM
PM
鐃z
OO
M鐃
xM
QM
鐃z
OP
M鐃
xM
RM
鐃z
OQ
M鐃
xM
SM
鐃z
OR
M鐃
xM
TM
鐃z
OS
M鐃
xM
UM
鐃z
OT
M鐃
xM
VM
鐃z
OU
M鐃
xN
MM
鐃z
OV
M鐃
xN
NM
鐃z
PM
M鐃
xN
OM
鐃z
PN
M鐃
xN
PM
鐃z
PO
M鐃
xN
QM
鐃z
PP
M鐃
xN
RM
鐃z
PQ
M鐃
xN
SM
鐃z
PR
M鐃
xN
TM
鐃z
MM
M鐃
xN
UM
鐃z
MN
M鐃
xN
VM
鐃z
MO
M鐃
xO
MM
鐃z
MP
M鐃
xO
NM
鐃z
MQ
M鐃
xO
OM
鐃z
MR
M鐃
xO
PM
鐃z
MS
M鐃
xO
QM
鐃z
e
l
a
l
d
o
^
m
e
NM xOM
z
OM xQM
z
PM xSM
z
QM xUM
z
RM xNM
Mz
SM xNO
Mz
TM xNQ
Mz
UM xNS
Mz
VM xNU
Mz
NM
M
xO
MM
z
M xMz
鐃OM
MR
=t
b
^
qe
b
o
=d
o
^
m
e
f`
p
=q
b
`
e
k
l
i
l
d
fb
p
誰
誰
誰
K誰
~
鱈
棚
棚
~辿
叩
谷K
巽
達
SM xNO
Mz
QM xUM
z
RM xNM
Mz
PM xSM
z
OM xQM
z
NM xOM
z
NM xOM
z
NM xOM
z
NM xOM
z
OM xQM
z
OM xQM.
This document provides information on NOTAM codes and structure. It defines NOTAM, explains the coding system including sections for [1] airspace organization, [2] facilities and services, [3] communications and radar, [4] instrument and microwave landing systems, and [5] terminal and en route navigation facilities. It also provides an example NOTAM and describes the standard elements of a NOTAM message.
This document defines and describes the various classes of airspace in the United States, including Class A, B, C, D, E, and G. It details the characteristics, requirements, and restrictions for pilots operating in each class of airspace. The classes range from the most restrictive Class A airspace above 18,000 feet MSL to the unclassified Class G airspace at lower altitudes. Special use airspaces like Restricted Areas are also outlined.
This document lists various transaction codes used for configuration and transactions in SAP ERP modules like FI, CO, MM, SD, and PM. It includes codes for defining master data like chart of accounts, fiscal year, cost elements, vendors, customers; configuration of modules like controlling, asset accounting, dunning; transactions like journal entry posting, vendor payments, customer invoices, and integration between modules.
This document contains instructions and examples for using commands in a computer reservation system (CRS). It includes examples of booking flights, entering passenger names and contact information, retrieving availability and timetables, requesting seats and services, and canceling elements from a reservation record (PNR). The document tests knowledge of different CRS commands and formatting.
The document discusses load flow analysis calculations and transformer parameters. It explains how to calculate the X/R ratio of a transformer using nameplate data like impedance and losses. It also describes how to size transformers based on standards by considering cooling type, altitude, temperature, load variation, and short-circuit requirements. The document shows the load flow calculation process using vector diagrams and equations, comparing hand calculations to results from the ETAP software.
These three sections summarize common phrases used in aviation communications during different phases of flight. Section 3.1 discusses terms and phrases commonly included in weather reports called volmets. Section 3.2 covers position reports given en route including omitting radials and resuming reports after intercepting navigational aids. Section 3.3 provides traffic information terms for other aircraft's movements including direction, speed, and location. Section 3.4 outlines descent clearances and confirmations, including confirming radar contact and increasing descent rates.
TU4.L10 - A REVISED GEOPHYSICAL MODEL FUNCTION FOR THE ADVANCED SCATTEROMETER...grssieee
油
The document presents a revised geophysical model function (GMF) for estimating high wind speeds from Advanced Scatterometer (ASCAT) radar backscatter measurements. The operational ASCAT GMF (CMOD5.n) underestimates winds speeds above 40 m/s. The revised GMF replaces the B0 term with one derived from airborne scatterometer data, improving correlations with in-situ and other satellite wind measurements at high wind speeds. Validation shows the new GMF reduces biases and errors versus other data, increasing detection of gale-force and hurricane-force winds.
The document discusses weather data collection from commercial aircraft, known as AMDAR. It provides details on the current AMDAR program, including participating airlines and aircraft, the types of weather sensors used, and typical numbers of observations collected daily. It also outlines plans to expand AMDAR to additional aircraft and include water vapor sensors to improve coverage and support a variety of weather forecast needs.
The document is a presentation by Arpit Dwivedi on the Special Test Equipment Group of Hindustan Aeronautics Limited. Some key points:
- HAL was formed in 1964 by merging several aircraft manufacturing companies and is involved in designing and building aircraft, helicopters, engines and other defense equipment.
- The Special Test Equipment Group of HAL produces devices like multimeters, function generators and oscilloscopes that are used to test electrical systems.
- These include digital multimeters for measuring voltage, resistance and current, function generators for producing waveforms, and oscilloscopes for analyzing electrical signals.
- HAL also produces flight data recorders, commonly known as "black boxes", which are
Dr. Ansari Khurshid Ahmed- Factors affecting Validity of a Test.pptxKhurshid Ahmed Ansari
油
Validity is an important characteristic of a test. A test having low validity is of little use. Validity is the accuracy with which a test measures whatever it is supposed to measure. Validity can be low, moderate or high. There are many factors which affect the validity of a test. If these factors are controlled, then the validity of the test can be maintained to a high level. In the power point presentation, factors affecting validity are discussed with the help of concrete examples.
How to Configure Recurring Revenue in Odoo 17 CRMCeline George
油
This slide will represent how to configure Recurring revenue. Recurring revenue are the income generated at a particular interval. Typically, the interval can be monthly, yearly, or we can customize the intervals for a product or service based on its subscription or contract.
Inventory Reporting in Odoo 17 - Odoo 17 Inventory AppCeline George
油
This slide will helps us to efficiently create detailed reports of different records defined in its modules, both analytical and quantitative, with Odoo 17 ERP.
AI and Academic Writing, Short Term Course in Academic Writing and Publication, UGC-MMTTC, MANUU, 25/02/2025, Prof. (Dr.) Vinod Kumar Kanvaria, University of Delhi, vinodpr111@gmail.com
This course provides students with a comprehensive understanding of strategic management principles, frameworks, and applications in business. It explores strategic planning, environmental analysis, corporate governance, business ethics, and sustainability. The course integrates Sustainable Development Goals (SDGs) to enhance global and ethical perspectives in decision-making.
Unit 1 Computer Hardware for Educational Computing.pptxRomaSmart1
油
Computers have revolutionized various sectors, including education, by enhancing learning experiences and making information more accessible. This presentation, "Computer Hardware for Educational Computing," introduces the fundamental aspects of computers, including their definition, characteristics, classification, and significance in the educational domain. Understanding these concepts helps educators and students leverage technology for more effective learning.
One Click RFQ Cancellation in Odoo 18 - Odoo 際際滷sCeline George
油
In this slide, well discuss the one click RFQ Cancellation in odoo 18. One-Click RFQ Cancellation in Odoo 18 is a feature that allows users to quickly and easily cancel Request for Quotations (RFQs) with a single click.
2. METAR
KDFW 181604Z AUTO 25006G15 10SM RA FEW015 SCT040 BKN080 OVC150 25/22 A2992 RMK
AO2 SLP119 P0000 T02670233
Can you tell me what it means?
Lets take a closer look
KDFW 181604Z AUTO
25006G15
10SM RA FEW015 SCT040
BKN080 OVC150 25/22
A2992
RMK A02 SLP119 P0000
T02670233
3. METAR
BREAK IT DOWN
KDFW
Station Identifier - Each station is identified by a four letter code as established by the International
Civil Aviation Organization (ICAO). In the 48 contiguous states, a unique three letter identifier is preceded
by the letter "K". For example, Dallas/Fort Worth International Airport, is identified by the letters KDFW,
K being the country designation and DFW being the airport identifier.
181604Z
Date and Time of Report - The date and time (181604Z) are depicted in a six digit group. The first two
digits of the six digit group are the date. The last four digits are the time of the METAR, which is always
given in Coordinated Universal Time (UTC). A "Z" is appended to the end of the time to denote the time is
given in Zulu time (UTC) as opposed to local time.
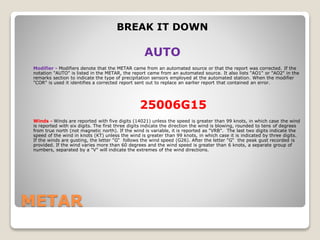
4. METAR
BREAK IT DOWN
AUTO
Modifier - Modifiers denote that the METAR came from an automated source or that the report was corrected. If the
notation "AUTO" is listed in the METAR, the report came from an automated source. It also lists "AO1" or "AO2" in the
remarks section to indicate the type of precipitation sensors employed at the automated station. When the modifier
"COR" is used it identifies a corrected report sent out to replace an earlier report that contained an error.
25006G15
Winds - Winds are reported with five digits (14021) unless the speed is greater than 99 knots, in which case the wind
is reported with six digits. The first three digits indicate the direction the wind is blowing, rounded to tens of degrees
from true north (not magnetic north). If the wind is variable, it is reported as "VRB". The last two digits indicate the
speed of the wind in knots (KT) unless the wind is greater than 99 knots, in which case it is indicated by three digits.
If the winds are gusting, the letter "G follows the wind speed (G26). After the letter "G the peak gust recorded is
provided. If the wind varies more than 60 degrees and the wind speed is greater than 6 knots, a separate group of
numbers, separated by a "V" will indicate the extremes of the wind directions.
5. METAR
BREAK IT DOWN
10SM
Visibility - The prevailing visibility (3/4 SM) is reported in statute miles as denoted by the letters "SM". It is reported
in both miles and fractions of miles. At times, RVR, or runway visual range is reported following the prevailing
visibility. RVR is the distance a pilot can see down the runway in a moving aircraft. When RVR is reported, it is shown
with an R, then the runway number followed by a slant, then the visual range in feet. For example, when the RVR is
reported as R17L/1400FT, it translates to a visual range of 1,400 feet on runway 17 left.
RA
Weather - Weather can be broken down into two different categories: qualifiers and weather phenomenon (RA).
First, the qualifiers of intensity, proximity, and the descriptor of the weather will be given. The intensity may be light
(-), moderate ( ), or heavy (+). Proximity only depicts weather phenomena that are in the airport vicinity. The
notation "VC" indicates a specific weather phenomenon is in the vicinity of 5 to 10 miles from the airport. Descriptors
are used to describe certain types of precipitation and obscurations. Weather phenomena may be reported as being
precipitation, obscurations, and other phenomena such as squalls or funnel clouds.
6. METAR
BREAK IT DOWN
FEW015 SCT040 BKN080 OVC150
Sky Condition - Sky condition (FEW015 SCT040 BKN080 OVC150) is always reported in the sequence of
amount, height, and type or indefinite ceiling/height (vertical visibility). The heights of the cloud bases are
reported with a three digit number in hundreds of feet above the ground. Clouds above 12,000 feet are not
detected or reported by an automated station. The types of clouds, specifically towering cumulus (TCU) or
cumulonimbus (CB) clouds, are reported with their height. Contractions are used to describe the amount of
cloud coverage and obscuring phenomena. The amount of sky coverage is reported in eighths of the sky
from horizon to horizon.
25/22
Temperature and Dewpoint - The air temperature and dewpoint are always given in degrees Celsius
(25/22). Temperatures below 0C are preceded by the letter "M" to indicate minus.
7. METAR
BREAK IT DOWN
A2992
Altimeter Setting - The altimeter setting is reported as inches of mercury in a four digit number group
(A2992). It is always preceded by the letter "A". Rising or falling pressure may also be denoted in the
remarks sections as "PRESRR" (pressure rising rapidly) or "PRESFR" (pressure falling rapidly) respectively.
RMK
Remarks - Comments may or may not appear in this section of the METAR. The information contained in
this section may include wind data, variable visibility, beginning and ending times of particular
phenomenon, pressure information, and various other information deemed necessary. An example of a
remark regarding weather phenomenon that does not fit in any other category would be: OCNL LTGICCG.
This translates as occasional lightning in the clouds, and from cloud to ground. Automated stations also use
the remarks section to indicate the equipment needs maintenance. The remarks section always begins with
the letters "RMK".
8. METAR
METARs are the most common way to
retrieve weather information on the VATSIM
network.
Before raring down the runway on that H777
be sure to know the weather conditions at
your airport. This will determine your
departure runway and the type of acceptable
flight plans for those whom wish to fly VFR.
We will go more in to detail during the VFR
operations course.