際際滷

際際滷Share a Scribd company logo
The Science of Macroeconomics 1
Learning Objectives This chapter introduces you to the issues macroeconomists study the tools macroeconomists use some important concepts in macroeconomic analysis
Important issues in macroeconomics Why does the cost of living keep rising? Why are millions of people unemployed,  even when the economy is booming? What causes recessions?  Can the government do anything to combat recessions?  Should it? Macroeconomics , the study of the economy as a whole, addresses many topical issues:
Important issues in macroeconomics What is the government budget deficit?  How does it affect the economy? Why does the U.S. have such a huge trade deficit?  Why are so many countries poor?  What policies might help them grow out of poverty? Macroeconomics , the study of the economy as a whole, addresses many topical issues:
U.S. Real GDP per capita  (2000 dollars) long-run upward trend Great Depression World War II First oil price shock Second oil price shock 9/11/2001
U.S. inflation rate (% per year)
U.S. unemployment rate (% of labor force)
Why learn macroeconomics? 1.  The macroeconomy affects societys well-being. Each one-point increase in the unemployment rate  is associated with: 920 more suicides 650 more homicides 4000 more people admitted to state mental institutions 3300 more people sent to state prisons 37,000 more deaths increases in domestic violence and homelessness
Why learn macroeconomics? 2.  The macroeconomy affects  your  well-being. In most years, wage growth falls when unemployment is rising.  change from 12 mos earlier percent change from 12 mos earlier
Why learn macroeconomics? 3.  The macroeconomy affects politics. Unemployment & inflation in election years year  U rate  inflation rate  elec. outcome 1976 7.7% 5.8% Carter (D) 1980 7.1% 13.5% Reagan (R) 1984 7.5% 4.3% Reagan (R) 1988 5.5% 4.1% Bush I (R) 1992 7.5% 3.0% Clinton (D) 1996 5.4% 3.3% Clinton (D) 2000 4.0% 3.4% Bush II (R) 2004 5.5% 3.3% Bush II (R)
Economic models are simplified versions of a more complex reality irrelevant details are stripped away are used to  Make testable predictions that can, when proven,     explain the economys behavior devise policies to improve economic performance
Example of a model:   Supply & demand for new cars shows how various events affect price and quantity of cars assumes the market is  competitive : each buyer and seller is too small to affect the market price Variables: Q   d  = quantity of cars that buyers demand Q   s  = quantity that producers supply P  = price of new cars Y  = aggregate income P s  = price of steel (an input)
The demand for cars Demand equation:  Q   d  =  D   ( P , Y  ) This says, in a concise way, that the quantity of cars consumers demand is related to the price of cars and aggregate income this notation technique is called functional notation;  Q d  or  D  is a function of  P  and  Y . I will use  colors  to indicate the way in which variables affect each other P has an  inverse  effect on D, whereas Y has a  direct  effect.
Digression:  functional notation General functional notation   shows only that the variables are related. Q   d  =  D   ( P,Y  ) A  specific functional form  shows  the precise quantitative relationship. Example:  D   ( P,Y  ) = 60  10 P  + 2 Y A list of the variables  that affect   Q   d
The market for cars:  Demand Q  Quantity of cars P  Price  of cars The  demand curve  shows the relationship between quantity demanded and price, other things equal.  D
The market for cars:  Supply Q  Quantity of cars P  Price  of cars D S The  supply curve  shows the relationship between quantity supplied and price, other things equal.
The market for cars:  Equilibrium Q  Quantity of cars P  Price  of cars S D equilibrium price equilibrium quantity
The effects of an increase in income An increase in income increases the quantity  of cars consumers demand at each price  which increases the equilibrium price and quantity. Q  Quantity of cars P  Price  of cars S D 1 Q 1 P 1 P 2 Q 2 D 2
The effects of a steel price increase An increase in  P s   reduces the quantity of cars producers supply at each price  which increases the market price and reduces the quantity. Q  Quantity of cars P  Price  of cars S 1 D Q 1 P 1 P 2 Q 2 S 2
Endogenous vs. exogenous variables The values of  endogenous  variables  are determined in the model. The values of  exogenous  variables  are determined outside the model:  the model takes their values & behavior  as given. In the model of supply & demand for cars,
Now you try: Write down demand and supply  equations for wireless phones;  include two exogenous variables  in each equation.  Draw a supply-demand graph  for wireless phones. Use your graph to show how a change in one of your exogenous variables affects the models endogenous variables.
A multitude of models No one model can address all the issues we care about.  e.g. , our supply-demand model of the car market can  tell us how a fall in aggregate income affects price & quantity of cars. cannot  tell us  why  aggregate income falls.
A multitude of models So we will learn different models for studying different issues ( e.g ., unemployment, inflation, long-run growth).  For each new model, you should keep track of  its assumptions  which variables are endogenous,  which are exogenous the questions it can help us understand,  and those it cannot
Prices:  flexible vs. sticky Market clearing :  An assumption that prices are flexible, adjust to equate supply and demand.  In the short run, many prices are  sticky    adjust sluggishly in response to changes in supply or demand.  For example,  many labor contracts fix the nominal wage  for a year or longer many magazine publishers change prices  only once every 3-4 years
Prices:  flexible vs. sticky The economys behavior depends partly on whether prices are sticky or flexible: If prices are sticky, then demand wont always equal supply.  This helps explain unemployment  (excess supply of labor) why firms cannot always sell all the goods  they produce Long run:  prices flexible, markets clear, economy behaves very differently
Outline of this book: Introductory material  (Chaps. 1 & 2) Classical Theory  (Chaps. 3-6)  How the economy works in the long run, when prices are flexible Growth Theory  (Chaps. 7-8) The standard of living and its growth rate over the very long run Business Cycle Theory  (Chaps. 9-13) How the economy works in the short run, when prices are sticky
Outline of this book: Policy debates  (Chaps. 14-15) Should the government try to smooth business cycle fluctuations?  Is the governments debt a problem?  Microeconomic foundations  (Chaps. 16-19) Insights from looking at the behavior of consumers, firms, and other issues from a microeconomic perspective
Chapter Summary Macroeconomics is the study of the economy as a whole, including growth in incomes, changes in the overall level of prices, the unemployment rate. Macroeconomists attempt to explain the economy and to devise policies to improve its performance. CHAPTER 1   The Science of Macroeconomics slide
Chapter Summary Economists use different models to examine different issues. Models with flexible prices describe the economy in the long run; models with sticky prices describe the economy in the short run. Macroeconomic events and performance arise from many microeconomic transactions, so macroeconomics uses many of the tools of microeconomics.  CHAPTER 1   The Science of Macroeconomics slide
Ad

Recommended

Iqra ea-introduction-2011
Mehreen Naz
Chap1(the science of macroeconomics)
BaserAhmad
1. cap鱈tulo 1
1. cap鱈tulo 1
Fabiana Martins
MACROECONOMICS-CH9
MACROECONOMICS-CH9
kkjjkevin03
Econ ppt 1
Econ ppt 1
Raymond Lin
Econ ppt 2
Econ ppt 2
Raymond Lin
Fundamentals Of Aggregate Demand And Aggregate Supply
Saurabh Goel
Managerial Economics
QualitativeIn
Aggregate Demand and Aggregate Supply
Lumen Learning
Macro diagrams and definitions
12jostma
LRAS SFLS
LRAS SFLS
ianhorner3
Fbla Economics Study Guide
economicsfbla
Market and Market Equilibrium
rahulmathur
Demand and supply functions in economics
vipul nigam
Demand And supply
Demand And supply
Yashika Parekh
Section 3 student version
Raymond Lin
Mock teaching macroeconomics
FAEZAH SAMSUDIN
Business economics lecture_2
zainab_05
Chapter 2
Chapter 2
Kusters Engineering India Pvt Ltd, Indian subsidiary of Royal Dutch Kusters Engineering BV
MACROECONOMICS-CH3
MACROECONOMICS-CH3
kkjjkevin03
Ten Principles of Economics and Concept of Demand and Supply by Prof. K K Kri...
BIMTECH Greater Noida
Market equilibrium by Maryan Joy Lopez
Maryan Lopez
Aggregate Supply / Aggregate Demand Model
Kaysee Das
PED & YED revision notes
Dr Srinivas A
Gregory mankiw macroeconomic 7th edition chapter (19)
Kyaw Thiha
SRAS SFLS
SRAS SFLS
ianhorner3
Managerial economics
sreejith s s
Market equilibrium
Market equilibrium
sdwaltton
Macroeconomic 3 economic growth
pelangi sepi
econ 2301 chapter 1 ppt
dhohnhol

More Related Content

What's hot (20)

Aggregate Demand and Aggregate Supply
Lumen Learning
Macro diagrams and definitions
12jostma
LRAS SFLS
LRAS SFLS
ianhorner3
Fbla Economics Study Guide
economicsfbla
Market and Market Equilibrium
rahulmathur
Demand and supply functions in economics
vipul nigam
Demand And supply
Demand And supply
Yashika Parekh
Section 3 student version
Raymond Lin
Mock teaching macroeconomics
FAEZAH SAMSUDIN
Business economics lecture_2
zainab_05
Chapter 2
Chapter 2
Kusters Engineering India Pvt Ltd, Indian subsidiary of Royal Dutch Kusters Engineering BV
MACROECONOMICS-CH3
MACROECONOMICS-CH3
kkjjkevin03
Ten Principles of Economics and Concept of Demand and Supply by Prof. K K Kri...
BIMTECH Greater Noida
Market equilibrium by Maryan Joy Lopez
Maryan Lopez
Aggregate Supply / Aggregate Demand Model
Kaysee Das
PED & YED revision notes
Dr Srinivas A
Gregory mankiw macroeconomic 7th edition chapter (19)
Kyaw Thiha
SRAS SFLS
SRAS SFLS
ianhorner3
Managerial economics
sreejith s s
Market equilibrium
Market equilibrium
sdwaltton
Aggregate Demand and Aggregate Supply
Lumen Learning
Macro diagrams and definitions
12jostma
Fbla Economics Study Guide
economicsfbla
Market and Market Equilibrium
rahulmathur
Demand and supply functions in economics
vipul nigam
Section 3 student version
Raymond Lin
Mock teaching macroeconomics
FAEZAH SAMSUDIN
Business economics lecture_2
zainab_05
MACROECONOMICS-CH3
MACROECONOMICS-CH3
kkjjkevin03
Ten Principles of Economics and Concept of Demand and Supply by Prof. K K Kri...
BIMTECH Greater Noida
Market equilibrium by Maryan Joy Lopez
Maryan Lopez
Aggregate Supply / Aggregate Demand Model
Kaysee Das
PED & YED revision notes
Dr Srinivas A
Gregory mankiw macroeconomic 7th edition chapter (19)
Kyaw Thiha
Managerial economics
sreejith s s
Market equilibrium
Market equilibrium
sdwaltton

Viewers also liked (7)

Macroeconomic 3 economic growth
pelangi sepi
econ 2301 chapter 1 ppt
dhohnhol
MACROECONOMICS-CH1
MACROECONOMICS-CH1
kkjjkevin03
MACROECONOMICS-CH2
MACROECONOMICS-CH2
kkjjkevin03
Chapter 1 - basic concepts about macroeconomics for BBA
ginish9841502661
Macroeconomics slide
Thao Nguyen
Macroeconomics exchange rate reforms 1982 in Pakistan. 1982 exchange rate ref...
Irfana Majid
Ad

Similar to Chap01 (20)

mankiw11e_lecture_slides_ch01.pptx
mseconomics
mankiw10e_lecturessssss_slides_ch01.pptx
ImranUmar27
Macro economics, G.mankiw, 1-The Science of Macroeconomics
Dr. Arifa Saeed
slidestopic1ho mankiw macroeconomyxx.ppt
baskoromaliki
chap01.ppt pertemuan 1 mata kuliahmakro ekonomi yang
AnwarPinem
principle of macroeconomic Mankiw chapter 01 ppt
dinalestari88
chap1.ppt
chap1.ppt
Haider Ali
gregorymankiwmacroeconomic7theditionchapter1-180917061743.pdf
yildirimfatih1
macro
macro
ilhamromadonasukses
Gregory mankiw macroeconomic 7th edition chapter (1)
Kyaw Thiha
chapter 01 makro.pdf bersumber dari buku G.Mankiw
AnwarPinem
MacroEconomics
MacroEconomics
ilhamromadonasukses
bai giang kinh te vi mo- 2023-UEH.pdf
VuHaiBang1
chap 1.Economic model and macro iindicators Mankiw.ppt
waleedlink96
chap 1.Economic model and macro iindicators Mankiw (1).ppt
maaidahussain1
chap01.ppt
chap01.ppt
ssuser87854a
Ch apter 1 The science of ecnomics by mankiw
SantosoAconk
Chap_01.PPT
Chap_01.PPT
uzma244191
mankiw-chapter-1-science-of-macroeconomics.ppt
JekyMuhammadFauzi1
lecture1.ppt
lecture1.ppt
PRADEEPPRAKASHSAMAL1
mankiw11e_lecture_slides_ch01.pptx
mseconomics
mankiw10e_lecturessssss_slides_ch01.pptx
ImranUmar27
Macro economics, G.mankiw, 1-The Science of Macroeconomics
Dr. Arifa Saeed
slidestopic1ho mankiw macroeconomyxx.ppt
baskoromaliki
chap01.ppt pertemuan 1 mata kuliahmakro ekonomi yang
AnwarPinem
principle of macroeconomic Mankiw chapter 01 ppt
dinalestari88
gregorymankiwmacroeconomic7theditionchapter1-180917061743.pdf
yildirimfatih1
Gregory mankiw macroeconomic 7th edition chapter (1)
Kyaw Thiha
chapter 01 makro.pdf bersumber dari buku G.Mankiw
AnwarPinem
bai giang kinh te vi mo- 2023-UEH.pdf
VuHaiBang1
chap 1.Economic model and macro iindicators Mankiw.ppt
waleedlink96
chap 1.Economic model and macro iindicators Mankiw (1).ppt
maaidahussain1
Ch apter 1 The science of ecnomics by mankiw
SantosoAconk
Chap_01.PPT
Chap_01.PPT
uzma244191
mankiw-chapter-1-science-of-macroeconomics.ppt
JekyMuhammadFauzi1
Ad

Chap01

  • 1. The Science of Macroeconomics 1
  • 2. Learning Objectives This chapter introduces you to the issues macroeconomists study the tools macroeconomists use some important concepts in macroeconomic analysis
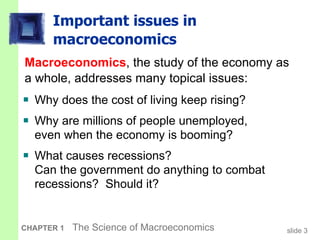
  • 3. Important issues in macroeconomics Why does the cost of living keep rising? Why are millions of people unemployed, even when the economy is booming? What causes recessions? Can the government do anything to combat recessions? Should it? Macroeconomics , the study of the economy as a whole, addresses many topical issues:
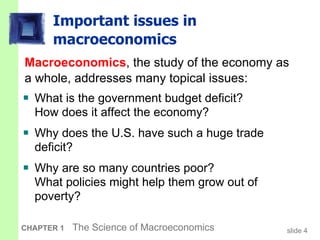
  • 4. Important issues in macroeconomics What is the government budget deficit? How does it affect the economy? Why does the U.S. have such a huge trade deficit? Why are so many countries poor? What policies might help them grow out of poverty? Macroeconomics , the study of the economy as a whole, addresses many topical issues:
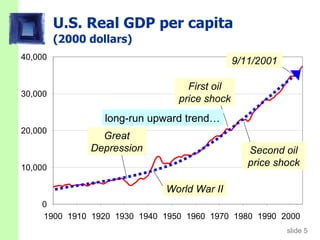
  • 5. U.S. Real GDP per capita (2000 dollars) long-run upward trend Great Depression World War II First oil price shock Second oil price shock 9/11/2001
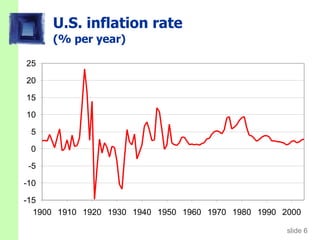
  • 6. U.S. inflation rate (% per year)
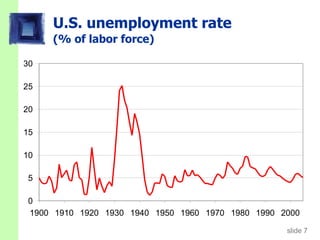
  • 7. U.S. unemployment rate (% of labor force)
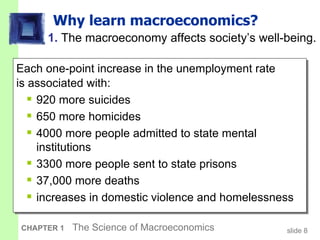
  • 8. Why learn macroeconomics? 1. The macroeconomy affects societys well-being. Each one-point increase in the unemployment rate is associated with: 920 more suicides 650 more homicides 4000 more people admitted to state mental institutions 3300 more people sent to state prisons 37,000 more deaths increases in domestic violence and homelessness
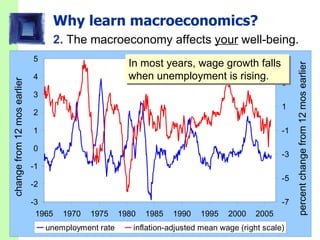
  • 9. Why learn macroeconomics? 2. The macroeconomy affects your well-being. In most years, wage growth falls when unemployment is rising. change from 12 mos earlier percent change from 12 mos earlier
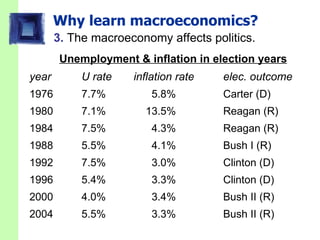
  • 10. Why learn macroeconomics? 3. The macroeconomy affects politics. Unemployment & inflation in election years year U rate inflation rate elec. outcome 1976 7.7% 5.8% Carter (D) 1980 7.1% 13.5% Reagan (R) 1984 7.5% 4.3% Reagan (R) 1988 5.5% 4.1% Bush I (R) 1992 7.5% 3.0% Clinton (D) 1996 5.4% 3.3% Clinton (D) 2000 4.0% 3.4% Bush II (R) 2004 5.5% 3.3% Bush II (R)
  • 11. Economic models are simplified versions of a more complex reality irrelevant details are stripped away are used to Make testable predictions that can, when proven, explain the economys behavior devise policies to improve economic performance
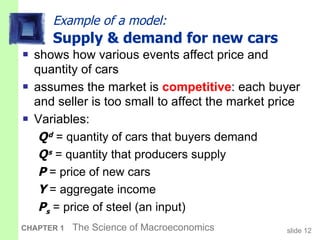
  • 12. Example of a model: Supply & demand for new cars shows how various events affect price and quantity of cars assumes the market is competitive : each buyer and seller is too small to affect the market price Variables: Q d = quantity of cars that buyers demand Q s = quantity that producers supply P = price of new cars Y = aggregate income P s = price of steel (an input)
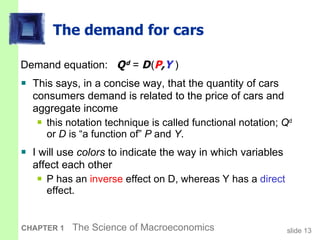
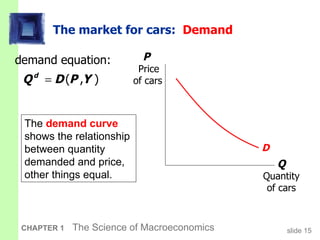
  • 13. The demand for cars Demand equation: Q d = D ( P , Y ) This says, in a concise way, that the quantity of cars consumers demand is related to the price of cars and aggregate income this notation technique is called functional notation; Q d or D is a function of P and Y . I will use colors to indicate the way in which variables affect each other P has an inverse effect on D, whereas Y has a direct effect.
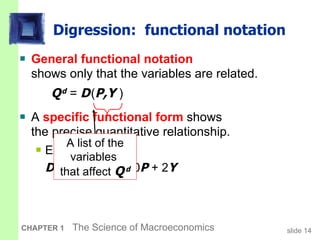
  • 14. Digression: functional notation General functional notation shows only that the variables are related. Q d = D ( P,Y ) A specific functional form shows the precise quantitative relationship. Example: D ( P,Y ) = 60 10 P + 2 Y A list of the variables that affect Q d
  • 15. The market for cars: Demand Q Quantity of cars P Price of cars The demand curve shows the relationship between quantity demanded and price, other things equal. D
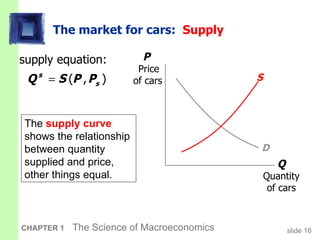
  • 16. The market for cars: Supply Q Quantity of cars P Price of cars D S The supply curve shows the relationship between quantity supplied and price, other things equal.
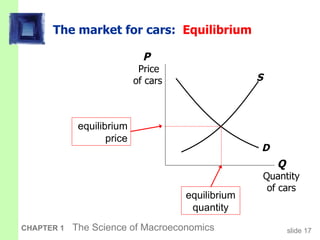
  • 17. The market for cars: Equilibrium Q Quantity of cars P Price of cars S D equilibrium price equilibrium quantity
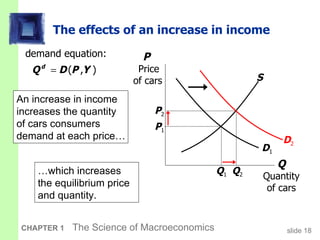
  • 18. The effects of an increase in income An increase in income increases the quantity of cars consumers demand at each price which increases the equilibrium price and quantity. Q Quantity of cars P Price of cars S D 1 Q 1 P 1 P 2 Q 2 D 2
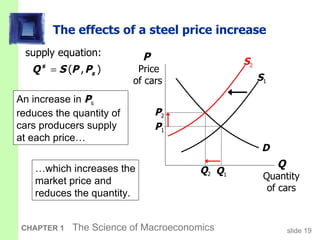
  • 19. The effects of a steel price increase An increase in P s reduces the quantity of cars producers supply at each price which increases the market price and reduces the quantity. Q Quantity of cars P Price of cars S 1 D Q 1 P 1 P 2 Q 2 S 2
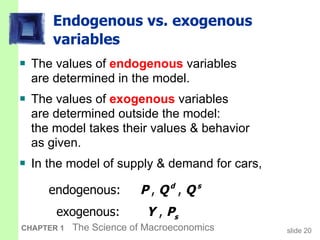
  • 20. Endogenous vs. exogenous variables The values of endogenous variables are determined in the model. The values of exogenous variables are determined outside the model: the model takes their values & behavior as given. In the model of supply & demand for cars,
  • 21. Now you try: Write down demand and supply equations for wireless phones; include two exogenous variables in each equation. Draw a supply-demand graph for wireless phones. Use your graph to show how a change in one of your exogenous variables affects the models endogenous variables.
  • 22. A multitude of models No one model can address all the issues we care about. e.g. , our supply-demand model of the car market can tell us how a fall in aggregate income affects price & quantity of cars. cannot tell us why aggregate income falls.
  • 23. A multitude of models So we will learn different models for studying different issues ( e.g ., unemployment, inflation, long-run growth). For each new model, you should keep track of its assumptions which variables are endogenous, which are exogenous the questions it can help us understand, and those it cannot
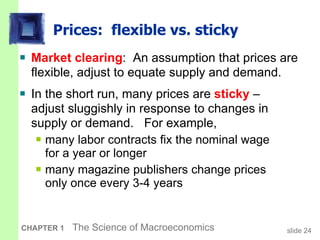
  • 24. Prices: flexible vs. sticky Market clearing : An assumption that prices are flexible, adjust to equate supply and demand. In the short run, many prices are sticky adjust sluggishly in response to changes in supply or demand. For example, many labor contracts fix the nominal wage for a year or longer many magazine publishers change prices only once every 3-4 years
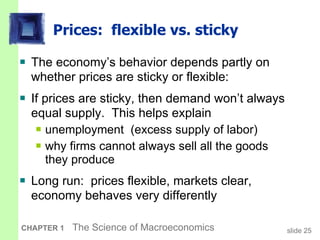
  • 25. Prices: flexible vs. sticky The economys behavior depends partly on whether prices are sticky or flexible: If prices are sticky, then demand wont always equal supply. This helps explain unemployment (excess supply of labor) why firms cannot always sell all the goods they produce Long run: prices flexible, markets clear, economy behaves very differently
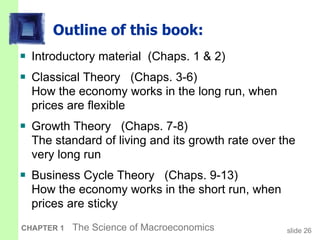
  • 26. Outline of this book: Introductory material (Chaps. 1 & 2) Classical Theory (Chaps. 3-6) How the economy works in the long run, when prices are flexible Growth Theory (Chaps. 7-8) The standard of living and its growth rate over the very long run Business Cycle Theory (Chaps. 9-13) How the economy works in the short run, when prices are sticky
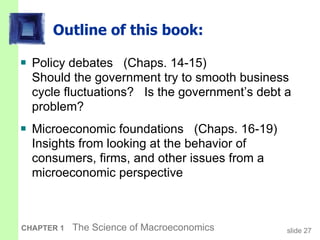
  • 27. Outline of this book: Policy debates (Chaps. 14-15) Should the government try to smooth business cycle fluctuations? Is the governments debt a problem? Microeconomic foundations (Chaps. 16-19) Insights from looking at the behavior of consumers, firms, and other issues from a microeconomic perspective
  • 28. Chapter Summary Macroeconomics is the study of the economy as a whole, including growth in incomes, changes in the overall level of prices, the unemployment rate. Macroeconomists attempt to explain the economy and to devise policies to improve its performance. CHAPTER 1 The Science of Macroeconomics slide
  • 29. Chapter Summary Economists use different models to examine different issues. Models with flexible prices describe the economy in the long run; models with sticky prices describe the economy in the short run. Macroeconomic events and performance arise from many microeconomic transactions, so macroeconomics uses many of the tools of microeconomics. CHAPTER 1 The Science of Macroeconomics slide

Editor's Notes

  • #2: Dear Colleague, Thank you for trying these PowerPoints. I have worked hard to make them useful, accurate, and interesting in hopes of saving you prep time and contributing to an effective classroom experience for your students. To help you get the most from these slides, I have prepared a README file with User Instructions, and I have annotated many individual slides with notes visible only to you that appear in this area of your screen. I will be preparing minor updates about once a year between major revisions of the text, to update the data and correct typos, etc. If you find a typo or have a suggestion, please email it to me and I will consider it for the next update. My email address is roncron@unlv.nevada.edu. Sincerely, Ron Cronovich
  • #4: This slide and the next contain a list of some topical issues that macro can help students understand. Feel free to substitute others as new issues emerge.
  • #9: It might be useful to briefly define the unemployment rate so that students will be able to understand this and the next few slides. Source: Barry Bluestone and Bennett Harrison, The Deindustrialization of America (New York: Basic Books, 1982), Chapter 3, cited in Robert J. Gordon, Macroeconomics, 4 th edition (Boston: Little, Brown and Company), p.334. If you know of more recent estimates, please email me so I can update this slide!!! Thanks! (My email address is roncron@unlv.nevada.edu)
  • #10: Macroeconomics helps students understand forces that will affect their financial well-being. Heres an example. When the unemployment rate is rising, tens or hundreds of thousands of people are losing their jobs. This affects even those who dont lose their jobs: As the graph shows, during most years there is a clear negative relationship between the (12-month) change in unemployment and the annual growth rate of real wages. In plain English, rising unemployment is associated with falling (and often negative) wage growth. So when the economy goes into recession, even if our students get to keep their jobs, they will find it much harder to get a raise, and may have to accept a real wage cut. Students find this relationship intuitive. When unemployment is rising, the supply of workers is rising faster than demand, so wages grow more slowly or even fall. Conversely, falling unemployment gives workers more bargaining power over wages, as it becomes increasingly hard for employers to replace their workers, and increasingly easy for workers to find good opportunities with other companies.
  • #11: Id also suggest you briefly define the inflation rate (as the percentage increase in the cost of living) to help students understand this slide. Main point of this data: The state of the economy has a huge impact on election outcomes. When the economy is doing poorly, there tends to be a change in the party that controls the White House. 1976: The rates of inflation ( ) and unemployment ( u ) both high. Incumbent (Ford, R) loses. 1980: u still high, even higher. Incumbent (Carter, D) loses. 1984: u still high, but much lower. Incumbent (Reagan) wins. 1988: the same, u much lower. Incumbent party wins. 1992: low, but u much higher (and was higher yet in 1991). Incumbent loses. 1996: u much lower, incumbent wins. 2000: Economy doing great, and incumbent party candidate (Gore, D) wins majority of popular vote, but loses electoral college to challenger. 2004: u somewhat higher, but lower than in 2001 recession; low; incumbent wins
  • #13: Students will realize that the auto market is not competitive. However, if all we want to know is how an increase in the price of steel or a fall in consumer income affects the price and quantity of autos, then its fine to use this model. In general, making unrealistic assumptions is okay, even desirable, if they simplify the analysis without affecting its validity.
  • #15: We often arent concerned with the exact quantitative relationship between variables, so we will often just use the general functional notation.
  • #22: Endogenous variables: price of wireless phones, quantity of wireless phones Exogenous variables: consumer income price of wireless phone service (a complement) price of landline phones & phone service (a substitute) technology
  • #27: The portion of the book described on this slide comprises the core material. It is organized around time horizons: the long run (flexible prices), the very long run (growth in capital, the population, and technology itself), and the short run (sticky prices and economic fluctuations). But wait! Theres more! See the next slide.
  • #28: All of the chapters listed on this slide are very good, but some instructors find that the semester isnt always long enough to cover all of this material. Feel free to select chapters from these parts that best match the needs and interests of you and your students. *** Are you covering Chapter 2 next? The PowerPoint presentation for Chapter 2 includes some in-class exercises to immediately reinforce concepts as they are presented. These exercises also help break up the lecture into smaller pieces. If youd like to try them, please ask your students to bring calculators to the next class meeting.