Chapter 11 ,Measures of Dispersion(statistics)
- 1. Chapter ŌĆō 11 Measures of Dispersion
- 3. ABSOLUTE AND RELATIVE MEASURES OF DISPERSION When dispersion of the series is expressed in terms of the original unit of the series, it is called absolute measure of dispersion. The relative measure of dispersion expresses the variability of data in terms of some relative value or percentage.
- 4. ’é© Range R = Upper Limit of the Last Class Interval ŌĆō Lower Limit of the First Class Interval Or R = H ŌĆō L Where R=Range; H=Highest value in the series; L=Lowest value in the series ’é© Coefficient of range CR = H ŌĆō L H + L Where CR=Coefficient of range; H=Highest value in the series; L=Lowest value in the series
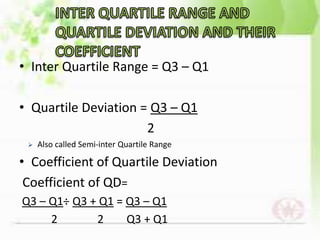
- 5. ŌĆó Inter Quartile Range = Q3 ŌĆō Q1 ŌĆó Quartile Deviation = Q3 ŌĆō Q1 2 ’āś Also called Semi-inter Quartile Range ŌĆó Coefficient of Quartile Deviation Coefficient of QD= Q3 ŌĆō Q1├Ę Q3 + Q1 = Q3 ŌĆō Q1 2 2 Q3 + Q1
- 6. QUARTILE DEVIATION Merits ŌĆó Simple ŌĆó Less effect of Extreme Values Demerits ŌĆó Not based on all Values ŌĆó Formation of Series not known ŌĆó Instability
- 7. ŌĆó Mean deviation is the arithmetic average of deviations of all the values consideration taken from a statistical average (mean, median or mode) of series. ŌĆó In taking deviation of values, algebraic signs + and ŌĆō are not taken into consideration, that is negative deviations are also treated as positive deviations
- 8. ŌĆō If deviations are taken from median ŌĆó MDm = Ōłæ | X ŌĆō M | or Ōłæ | dm | N N ŌĆō If deviations are taken from arithmetic average ŌĆó MDx = Ōłæ | X ŌĆō X | or Ōłæ | d x | N N Where, MD = Mean deviation ; X ŌĆō M = Deviation from the median ; X - X = deviation from the arithmetic average ; N = Number of items
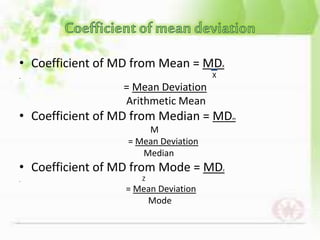
- 9. ŌĆó Coefficient of MD from Mean = MDx X = Mean Deviation Arithmetic Mean ŌĆó Coefficient of MD from Median = MDm M = Mean Deviation Median ŌĆó Coefficient of MD from Mode = MDz Z = Mean Deviation Mode
- 10. MEAN DEVIATION Merits ŌĆó Simple ŌĆó Based on all Values ŌĆó Less Effect of Extreme Values Demerits ŌĆó Inaccuracy ŌĆó Not Capable of Algebraic Treatment ŌĆó Unreliable
- 11. ŌĆó Standard Deviation is the Square root of the Arithmetic Mean of the squares of deviations of the items from their mean value. This is generally denoted by (sigma) of the Greek language. ŌĆó COEFFICIENT OF STANDARD DEVIATION = Žā X
- 12. Merits ŌĆó Based on all Values ŌĆó Certain Measure ŌĆó Little Effect of a Change in Sample ŌĆó Algebraic Treatment Demerits ŌĆó Difficult ŌĆó More Importance to Extreme Value
- 13. ŌĆó Lorenz Curve is a measure of deviation of actual distribution from the line of equal distribution. ŌĆó Lorenz curve as a measure of dispersion is presently applied to the following parameters, viz., 1. Distribution of income 2. Distribution of wealth 3. Distribution of wages 4. Distribution of profits 5. Distribution of production 6. Distribution of population
- 14. ŌĆó By ŌĆśLess thanŌĆÖ orŌĆśMore thanŌĆÖ ogives methoda frequency distribution series is first converted into a less than ormorethan cumulative series as in the cas e of ogives, data arepresented graphically to make a ŌĆśless thanŌĆÖ or ŌĆśmore thanŌĆÖ ogive, N/2 item of the series is determined and from this point (on the y-axis of the graph)a perpendicular is drawn to the right to cut the cumulative frequency curve.The medianvalue is the o newhere cumulative frequency curvecuts corresponding to x-axis. ŌĆó Less than and more than ogive curve method present the data graphical ly in the form of ŌĆśless thanŌĆÖ and ŌĆśmore thanŌĆÖ ogives simultaneously. The two ogives aresuperimposed upon eachother t o determine the median value. Mark the point where the ogive curvecut each other, draw a perpendicular from that point on x- axis, the corresponding value on the x-axis would be the median value.
- 15. ŌĆó Prepare a histogram from the data. ŌĆó Find out the rectangle whose height is the highest. This will be the modal class. ŌĆó Draw two lines - one joining the top right point of the rectangle preceding the modal class with top right point of the modal class. ŌĆó The other joining the top left point of the modal classwith the top left point of the post modal class. From the point of i ntersection of these two diagonal lines, drawa perpendicular on horizo ntal axisi.e. xaxisthe point where this perpendicular linemeets x- axis, gives us the value of mode.


