Chapter 4
•Download as DOCX, PDF•
0 likes•233 views

This chapter presents an analysis of data collected from a survey of ULS faculty members about their knowledge of health risks related to food and herbal supplements. Several tables show the distribution of respondents by demographic characteristics such as age, gender, education level, civil status and religion. The majority of respondents were female, aged 50-54, had a master's degree, were married and Roman Catholic. Additional tables break down the types of supplements used by gender and the length of time female respondents had been using supplements, with vitamins and less than 6 months being the most common responses.


Chapter 4
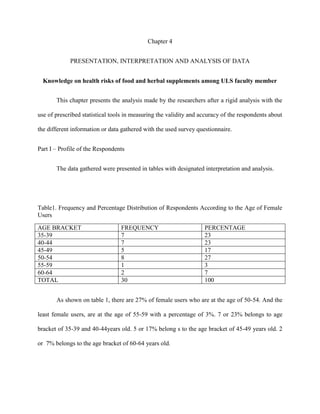
- 1. Chapter 4 PRESENTATION, INTERPRETATION AND ANALYSIS OF DATA Knowledge on health risks of food and herbal supplements among ULS faculty member This chapter presents the analysis made by the researchers after a rigid analysis with the use of prescribed statistical tools in measuring the validity and accuracy of the respondents about the different information or data gathered with the used survey questionnaire. Part I – Profile of the Respondents The data gathered were presented in tables with designated interpretation and analysis. Table1. Frequency and Percentage Distribution of Respondents According to the Age of Female Users AGE BRACKET FREQUENCY PERCENTAGE 35-39 7 23 40-44 7 23 45-49 5 17 50-54 8 27 55-59 1 3 60-64 2 7 TOTAL 30 100 As shown on table 1, there are 27% of female users who are at the age of 50-54. And the least female users, are at the age of 55-59 with a percentage of 3%. 7 or 23% belongs to age bracket of 35-39 and 40-44years old. 5 or 17% belong s to the age bracket of 45-49 years old. 2 or 7% belongs to the age bracket of 60-64 years old.
- 2. Table 2. Frequency and Percentage Distribution of Respondents According to the Age of Male Users AGE BRACKET FREQUENCY PERCENTAGE 35-39 4 40 40-44 3 30 45-49 0 0 50-54 0 0 55-59 2 20 60-64 1 10 TOTAL 10 100 As shown in table 2, most male users are at the age of 35-39, with a percentage of 40 or 4. And the least male users are at the age of 60-64 with a percentage of 10 or 1. 30% or 3 are at the age of 40-44. 20% or 2 are at the age bracket of 55-59.It shows that majority of the respondents were at the age bracket of 50-54 years old for female and 35-39years old for male. Table 3. Frequency and Percentage Distribution of Respondents According to Gender GENDER FREQUENCY PERCENTAGE Male 10 25 Female 30 75 TOTAL 40 100 As presented on table 3, most of the respondents are female with a percentage of 75. And 25% or 10 were male users of food supplements and herbal products. It shows that majority of the respondents are female.
- 3. Table 4. Frequency and Percentage Distribution of Respondents According to the Educational Attainment of Female Users EDUCATIONAL FREQUENCY PERCENTAGE ATTAINMENT College Graduate 3 10 Masteral 26 87 Doctorate 1 3 TOTAL 30 100 As presented in table 4, 26 or 87% from the female respondents are masteral graduate. 3 or 10% are college graduate and 1 or 3% who finished doctoral. Table 5. Frequency and Percentage Distribution of Respondents According to the Educational Attainment of male Users EDUCATIONAL FREQUENCY PERCENTAGE ATTAINMENT College Graduate 1 10 Masteral 9 90 Doctorate 0 0 TOTAL 10 100 As presented on table 5, there were 9 or 90% male users who graduated with master‟s degree. And only 1 or 1% is college graduate. It shows that majority of the respondents are masteral graduate.
- 4. Table 6. Frequency and Percentage Distribution of Respondents According to the Civil Status of Female Users CIVIL STATUS FREQUENCY PERCENTAGE Single 0 0 Married 28 94 Widowed 1 3 Separated 1 3 TOTAL 30 100 As gleaned on table 6, 28 or 94% are the married female users. 3% are the widowed and separated female users. Table 7. Frequency and Percentage Distribution of Respondents According to the Civil Status of Male Users CIVIL STATUS FREQUENCY PERCENTAGE Single 0 0 Married 10 100 Widowed 0 0 Separated 0 0 TOTAL 10 100 As presented on table 7, all male respondents were married. It shows that majority of the respondents were married. Table 8. Frequency and Percentage Distribution of Respondents According to the Religion of Female Users
- 5. RELIGION FREQUENCY PERCENTAGE Roman Catholic 0 0 Iglesia Ni Cristo 30 100 Protestant 0 0 TOTAL 30 100 As shown, on table 8,all of the female respondents are Roman Catholic in religion with a percentage of 100. Table 9. Frequency and Percentage Distribution of Respondents According to the Religion of Male Users RELIGION FREQUENCY PERCENTAGE Roman Catholic 10 100 Iglesia Ni Cristo 0 0 Protestant 0 0 TOTAL 10 100 As gleaned on table 9, all of the male respondents are Roman Catholic in religion with a percentage of 100. It shows that all of the respondents are Roman Catholic. Table 10. Frequency and Percentage Distribution of Respondents According to the Type of Food Supplement Used by Female Users TYPE OF FOOD FREQUENCY PERCENTAGE SUPPLEMENT HERBAL TEA 5 17 HERBAL CAPSULE 4 13 HERBAL JUICE 4 13 AMPALAYA TEA 4 13 AMPALAYA CAPSULE 0 0 HERBAL EXTRACT 0 0 PROBIOTICS 4 13
- 6. VITAMINS 9 31 TOTAL 30 100 As gleaned on table 10, 31% or 9 of female use vitamins. 17% or 5 of them use herbal tea and 13% or 4 of them use herbal capsule, herbal juice, ampalaya tea, and probiotics. Table 11. Frequency and Percentage Distribution of Respondents According to the Type of Food Supplement Used by Male Users TYPE OF FOOD FREQUENCY PERCENTAGE SUPPLEMENT HERBAL TEA 3 30 HERBAL CAPSULE 2 20 HERBAL JUICE 1 10 AMPALAYA TEA 1 10 AMPALAYA CAPSULE 0 0 HERBAL EXTRACT 1 10 PROBIOTICS 1 10 VITAMINS 1 10 TOTAL 10 100 As shown on table 11, most of the male use herbal tea with a percentage of 30. 20% of them use herbal capsule. And 10% of them use herbal juice, herbal extract, probiotics and vitamins.It shows that majority of the respondents use vitamins. Table 12. Frequency and Percentage Distribution of Respondents According to the Length of time that Female Users have been using the Food Supplement LENGTH OF TIME FREQUENCY PERCENTAGE
- 7. LESS THAN 6 MOS. 16 53 6 MOS. – 1 YEAR 6 20 1 YEAR-5 YEARS 8 27 TOTAL 30 100 As shown on table 12, most of the female use herbal supplements for less than 6 months with a percentage of 16. 27% of them use herbal supplements for almost 6 months – 1 year. 20% or 6 of them use herbal supplement for 6 months-1year. Table 13. Frequency and Percentage Distribution of Respondents According to the Length of time that Male Users have been using the Food Supplement LENGTH OF TIME FREQUENCY PERCENTAGE LESS THAN 6 MOS. 5 50 6 MOS. – 1 YEAR 2 20 1 YEAR-5 YEARS 3 30 TOTAL 10 100 As shown on table 13, male use herbal supplements for less than 6 months with a percentage of 50. 30% of them use herbal supplements for 1 year- 5 years. And 20% of them use herbal supplements for almost 6 months- 1 year.It shows that majority of the respondents use herbal supplements for less than 6 months. Table 14. Frequency and Percentage Distribution of Respondents According to the Benefits gained by Female Users BENEFITS FREQUENCY PERCENTAGE
- 8. RELIEF OF SYMPTOMS 4 13 WEIGHT GAIN 0 0 WEIGHT LOSS 5 17 REGULATION OF BP 0 0 REGULATION OF SUGAR 5 17 IMPROVEMENT IN 16 53 FUNCTIONING TOTAL 30 100 As shown on table 14, 53% of female users stated improvement in functioning as health benefits when using herbal products. 17% of them stated weight loss and regulation of blood sugar as their health benefits. 13% of them stated a relief of symptoms as their health benefits. Table 15. Frequency and Percentage Distribution of Respondents According to the Benefits gained by Male Users BENEFITS FREQUENCY PERCENTAGE RELIEF OF SYMPTOMS 0 0 WEIGHT GAIN 0 0 WEIGHT LOSS 1 10 REGULATION OF BP 1 10 REGULATION OF SUGAR 2 20 IMPROVEMENT IN 6 60 FUNCTIONING TOTAL 10 100 As presented on table 15, 60% of male users stated improvement in functioning as their health benefits in using herbal products. 20% of them stated regulation of blood sugar. 10% of them stated regulation of blood pressure and weight loss as their health benefits. It shows that majority of the respondents improved their functioning when using herbal products.
- 9. Table 16. Frequency and Percentage Distribution of Respondents According to the Common Side Effects Experienced by Female Users SIDE EFFECT FREQUENCY PERCENTAGE WEIGHT LOSS 3 10 DIARRHEA 3 10 NONE 24 80 TOTAL 30 100 As gleaned on table 16, 80% of female users stated that there are no side effects of food supplements and herbal products. 10% of them stated weight loss and diarrhea as side effects. Table 17. Frequency and Percentage Distribution of Respondents According to the Common Side Effects Experienced by Male Users SIDE EFFECT FREQUENCY PERCENTAGE WEIGHT GAIN 1 10 WEIGHT LOSS 1 10 ORANGE URINE 1 10 NONE 7 70 TOTAL 10 100 As presented on table 17, 70% of female users stated that there were no side effects of food and herbal supplements. 10% stated that weight gain, weight loss and orange urine are the side effects. It shows that majority of the respondents experienced no side effects when using food and herbal products.
- 10. Table 18. Frequency and Percentage Distribution of Respondents According to Whom the Female Users knew of this product WHO RECOMMENDED FREQUENCY PERCENTAGE THE PRODUCT DOCTOR 12 40 CO-WORKER 12 40 NEIGHBOR 0 0 RELATIVE 6 20 TOTAL 30 100 As shown on table 18, 40% of female users knew the products through co-worker and through recommendations of doctor. 20% of them knew the product through relatives. Table 19. Frequency and Percentage Distribution of Respondents According to Whom the Male Users knew of this product WHO RECOMMENDED FREQUENCY PERCENTAGE THE PRODUCT DOCTOR 3 30 CO-WORKER 3 30 NEIGHBOR 0 0 RELATIVE 4 40 TOTAL 10 100 As presented on table 19, 40% of male users knew the products through relatives and 30% of them knew the products through doctor and co-workers.It shows that majority of the respondents knew the products through co-workers and recommendations of doctor. Table 20. Frequency and Percentage Distribution of Respondents on How Female Users knew of this product
- 11. HOW THEY KNEW OF FREQUENCY PERCENTAGE THIS PRODUCT TV 17 57 RADIO 0 0 PRINT MEDIA 1 3 WORD OF MOUTH 12 40 TOTAL 30 100 As shown on table20, 57% of the female users knew the products by watching on advertisements via television. 3% of them knew the products via print media. Table 21. Frequency and Percentage Distribution of Respondents on How Male Users knew of this product HOW THEY KNEW OF FREQUENCY PERCENTAGE THIS PRODUCT TV 6 60 RADIO 0 0 PRINT MEDIA 0 0 WORD OF MOUTH 4 40 TOTAL 10 As shown on table 21, 60% of the male users knew the products via television. And 40% of them knew the products through word of mouth. It shows that majority of the respondents knew the products through watching television. Table 22. Frequency and Percentage Distribution According to Female User‟s Reason for patronizing the product
- 12. REASON FOR FREQUENCY PERCENTAGE PATRONIZING HEALTH BENEFITS 23 77 SERVES AS MEDICAL 1 3 SUBSTITUTE FEAR OF ACQUIRING 6 20 DISEASE COST 0 0 TREND 0 0 TOTAL 30 100 As presented on table 22, 77% of female users stated that health benefits were the reasons for patronizing the product. 3% of them stated that food and herbal supplements serve as medical substitute. Table 23. Frequency and Percentage Distribution According to Female User‟s Reason for patronizing the product REASON FOR FREQUENCY PERCENTAGE PATRONIZING HEALTH BENEFITS 7 70 SERVES AS MEDICAL 0 0 SUBSTITUTE FEAR OF ACQUIRING 1 10 DISEASE COST 0 0 TREND 0 0 TOTAL 10 100 As gleaned on table 23, 70% of male users stated that health benefits were the reason for patronizing the products. 10% of them stated that they are afraid of acquiring a disease as the reason of patronizing the product.It shows that majority of the respondents continue patronizing the products because of health benefits it give.
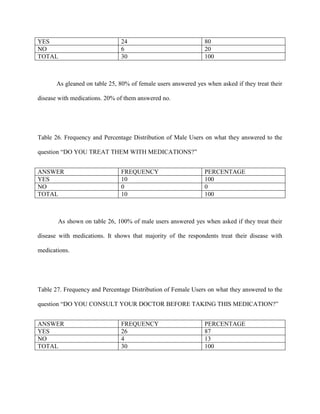
- 13. Table 23. Frequency and Percentage Distribution of Female Users on what they answered to the question “HAVE YOU EXPERIENCED SYMPTOMS OR ANY DISEASE PROCESS?” ANSWER FREQUENCY PERCENTAGE YES 25 83 NO 5 17 TOTAL 10 100 As presented on table 23, 83% of female users answered yes when asked if they experienced any symptoms of any disease process. 17% of them answered no. Table 24. Frequency and Percentage Distribution of Male Users on what they answered to the question “HAVE YOU EXPERIENCED SYMPTOMS OR ANY DISEASE PROCESS?” ANSWER FREQUENCY PERCENTAGE YES 10 100 NO 0 0 TOTAL 10 100 As shown on table 24, 100% of male users answered yes when asked if they experienced symptoms of any disease process. It shows that majority of the respondents experienced symptoms of any disease process. Table 25. Frequency and Percentage Distribution of Female Users on what they answered to the question “DO YOU TREAT THEM WITH MEDICATIONS?” ANSWER FREQUENCY PERCENTAGE
- 14. YES 24 80 NO 6 20 TOTAL 30 100 As gleaned on table 25, 80% of female users answered yes when asked if they treat their disease with medications. 20% of them answered no. Table 26. Frequency and Percentage Distribution of Male Users on what they answered to the question “DO YOU TREAT THEM WITH MEDICATIONS?” ANSWER FREQUENCY PERCENTAGE YES 10 100 NO 0 0 TOTAL 10 100 As shown on table 26, 100% of male users answered yes when asked if they treat their disease with medications. It shows that majority of the respondents treat their disease with medications. Table 27. Frequency and Percentage Distribution of Female Users on what they answered to the question “DO YOU CONSULT YOUR DOCTOR BEFORE TAKING THIS MEDICATION?” ANSWER FREQUENCY PERCENTAGE YES 26 87 NO 4 13 TOTAL 30 100
- 15. As presented on table 27, 87% of female users consult their doctor before taking medications. 13% of them are not consulting their doctor. Table 28. Frequency and Percentage Distribution of Male Users on what they answered to the question “DO YOU CONSULT YOUR DOCTOR BEFORE TAKING THIS MEDICATION?” ANSWER FREQUENCY PERCENTAGE YES 8 80 NO 2 20 TOTAL 10 10 As presented on table 28, 80% of male users consult their doctor before taking medications. And 20% of them are not consulting their doctor. It shows that majority of the respondents consult their doctor before taking medications. Table 29. Frequency and Percentage Distribution of Female Users on what they answered to the question “DO YOU USE NATURAL PRODUCTS?” ANSWER FREQUENCY PERCENTAGE YES 27 90 NO 3 10 TOTAL 30 100 As gleaned on table 29, 90% of female use natural products. 10% of them doesn‟t use natural products.
- 16. Table 30. Frequency and Percentage Distribution of Male Users on what they answered to the question “DO YOU USE NATURAL PRODUCTS?” ANSWER FREQUENCY PERCENTAGE YES 10 100 NO 0 0 TOTAL 10 100 As shown on table 30, 100% of male use natural products. It shows that majority of the respondents are using natural products. Table 29. Frequency and Percentage Distribution of Female Users on what they answered to the question “ARE YOU USING FOOD SUPPLEMENTS?” ANSWER FREQUENCY PERCENTAGE YES 27 90 NO 3 10 TOTAL 30 100 As presented on table 29, 90% of female use food supplements. And 10% of them are not using. Table 30. Frequency and Percentage Distribution of Male Users on what they answered to the question “ARE YOU USING FOOD SUPPLEMENTS?” ANSWER FREQUENCY PERCENTAGE YES 10 100 NO 0 0 TOTAL 10 100
- 17. As gleaned on table 30, 100% of male use food supplements. It shows that majority of the respondents use food supplements. Table 31. Frequency and Percentage Distribution of Female Users on what they answered to the question “HAVE YOU BEEN TAKING IT FOR A LONG TIME?” ANSWER FREQUENCY PERCENTAGE YES 20 67 NO 10 33 TOTAL 30 100 As shown on table 31, 67% of female users said they are taking the food supplement for a long time. 33% of them answered no. Table 32. Frequency and Percentage Distribution of Male Users on what they answered to the question “HAVE YOU BEEN TAKING IT FOR A LONG TIME?” ANSWER FREQUENCY PERCENTAGE YES 6 60 NO 4 40 TOTAL 10 10 As presented on table 32, 60% of male users said they are taking the food supplement for a long time. And 40% answered no. It shows that majority of the respondents take the food supplements for a long time.
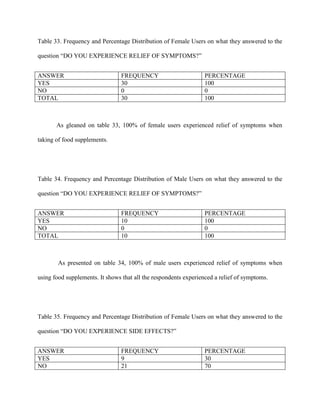
- 18. Table 33. Frequency and Percentage Distribution of Female Users on what they answered to the question “DO YOU EXPERIENCE RELIEF OF SYMPTOMS?” ANSWER FREQUENCY PERCENTAGE YES 30 100 NO 0 0 TOTAL 30 100 As gleaned on table 33, 100% of female users experienced relief of symptoms when taking of food supplements. Table 34. Frequency and Percentage Distribution of Male Users on what they answered to the question “DO YOU EXPERIENCE RELIEF OF SYMPTOMS?” ANSWER FREQUENCY PERCENTAGE YES 10 100 NO 0 0 TOTAL 10 100 As presented on table 34, 100% of male users experienced relief of symptoms when using food supplements. It shows that all the respondents experienced a relief of symptoms. Table 35. Frequency and Percentage Distribution of Female Users on what they answered to the question “DO YOU EXPERIENCE SIDE EFFECTS?” ANSWER FREQUENCY PERCENTAGE YES 9 30 NO 21 70
- 19. TOTAL 30 100 As shown on table 35, 70% of female users stated they did not experienced side effects. 30% of them stated they do experienced side effects of food supplements. Table 36. Frequency and Percentage Distribution of Male Users on what they answered to the question “DO YOU EXPERIENCE SIDE EFFECTS?” ANSWER FREQUENCY PERCENTAGE YES 4 40 NO 6 60 TOTAL 10 100 As gleaned on table 36, most of the female users experienced side effects with a percentage of 60. 40% answerethay did not experienced any side effects. It shows that majority of the respondents do not experienced side effects brought by the food supplements. Table 37. Frequency and Percentage Distribution of Female Users on what they answered to the question “DO YOU KNOW THAT SUPPLEMENTS ARE NOT TESTED BY FDA?” ANSWER FREQUENCY PERCENTAGE VERY 10 33 KNOWLEDGEABLE KNOWLEDGEABLE 14 47
- 20. SLIGHTLY 5 17 KNOWLEDGEABLE NOT KNOWLEDGEABLE 1 3 TOTAL 30 100 WEIGHTED MEAN 3.1 INTERPRETATION KNOWLEDGEABLE As presented on table 37, as 3.1weighted mean, it shows that female users are knowledgeable that food supplements are not tested by FDA. Table 38. Frequency and Percentage Distribution of Male Users on what they answered to the question “DO YOU KNOW THAT SUPPLEMENTS ARE NOT TESTED BY FDA?” ANSWER FREQUENCY PERCENTAGE VERY 3 30 KNOWLEDGEABLE KNOWLEDGEABLE 3 30 SLIGHTLY 3 30 KNOWLEDGEABLE NOT 1 10 KNOWLEDGEABLE TOTAL 10 100 WEIGHTEDMEAN 2.8 INTERPRETATION KNOWLEDGEABLE As presented on table 38, as 2.8 weighted mean, it shows that male users are knowledgeable that food supplements are not tested by FDA. It shows that majority of the respondents are knowledgeable that food supplements are not tested by FDA.
- 21. Table 39. Frequency and Percentage Distribution of Female Users on what they answered to the question “DO YOU KNOW THE MEANING OF „NO APPROVED THERAPEUTIC CLAIMS?” ANSWER FREQUENCY PERCENTAGE VERY 27 90 KNOWLEDGEABLE KNOWLEDGEABLE 2 7 SLIGHTLY 1 3 KNOWLEDGEABLE NOT 0 0 KNOWLEDGEABLE TOTAL 30 100 WEIGHTEDMEAN 3.86 INTERPRETATION VERY KNOWLEDGEABLE As shown on table 39, as 3.86 weighted mean, it shows that female are very knowledgeable about the meaning of “ NO APPROVED THERAPEUTIC CLAIMS” Table 40. Frequency and Percentage Distribution of Male Users on what they answered to the question “DO YOU KNOW THE MEANING OF „NO APPROVED THERAPEUTIC CLAIMS?” ANSWER FREQUENCY PERCENTAGE VERY KNOWLEDGEABLE 8 80 KNOWLEDGEABLE 1 10 SLIGHTLY 1 10 KNOWLEDGEABLE NOT KNOWLEDGEABLE 0 0 TOTAL 10 100 WEIGHTEDMEAN 3.7 INTERPRETATION VERY KNOWLEDGEABLE
- 22. As shown on table 40, as 3.7 weighted mean, it shows that male are very knowledgeable about the meaning of “ NO APPROVED THERAPEUTIC CLAIMS” it shows that majority of the respondents are very knowledgeable about the meaning of “ NO APPROVED THERAPEUTIC CLAIMS.” Table 41. Frequency and Percentage Distribution of Female Users on what they answered to the question “DO YOU KNOW THE EFFECTS OF SUPPLEMENTS THAT YOU ARE TAKING?” ANSWER FREQUENCY PERCENTAGE VERY KNOWLEDGEABLE 17 57 KNOWLEDGEABLE 8 27 SLIGHTLY 4 13 KNOWLEDGEABLE NOT KNOWLEDGEABLE 1 3 TOTAL 30 100 WEIGHTEDMEAN 3.37 INTERPRETATION VERY KNOWLEDGEABLE As shown on table 41, as 3.37 weighted mean, it shows that female users are very knowledgeable about the effects of food supplements that they are taking. Table 42. Frequency and Percentage Distribution of Male Users on what they answered to the question “DO YOU KNOW THE EFFECTS OF SUPPLEMENTS THAT YOU ARE TAKING?” ANSWER FREQUENCY PERCENTAGE VERY KNOWLEDGEABLE 6 60
- 23. KNOWLEDGEABLE 1 10 SLIGHTLY 1 10 KNOWLEDGEABLE NOT KNOWLEDGEABLE 2 20 TOTAL 10 100 WEIGHTEDMEAN 3.1 INTERPRETATION KNOWLEDGEABLE As shown on table 42, as 3.1 weighted mean, it shows that male users are knowledgeable about the effects of food supplements that they are taking. It shows that majority of the respondents are very knowledgeable about the effects of supplements that they are taking. Table 43. Frequency and Percentage Distribution of Female Users on what they answered to the question “DO YOU KNOW THE HEALTH RISKS WHEN TAKING THESE SUPPLEMENTS?” ANSWER FREQUENCY PERCENTAGE VERY KNOWLEDGEABLE 9 31 KNOWLEDGEABLE 10 33 SLIGHTLY 10 33 KNOWLEDGEABLE NOT KNOWLEDGEABLE 1 3 TOTAL 30 100 WEIGHTEDMEAN 2.9 INTERPRETATION KNOWLEDGEABLE As gleaned on table 43, as 2.9 weighted mean, it shows that female users are knowledgeable about the health risks of taking these food supplements.
- 24. Table 44. Frequency and Percentage Distribution of Male Users on what they answered to the question “DO YOU KNOW THE HEALTH RISKS WHEN TAKING THESE SUPPLEMENTS?” ANSWER FREQUENCY PERCENTAGE VERY KNOWLEDGEABLE 1 10 KNOWLEDGEABLE 3 30 SLIGHTLY 4 40 KNOWLEDGEABLE NOT KNOWLEDGEABLE 2 20 TOTAL 10 100 WEIGHTEDMEAN 2.3 INTERPRETATION SLIGHTLY KNOWLEDGEABLE As gleaned on table 44, as 2.3 weighted mean, it shows that male users are slightly knowledgeable about the health risks of taking these food supplements.It shows that majority of the respondents are slightly knowlegeable about the health risks of these food supplements. Table 45. Frequency and Percentage Distribution of Female Users on what they answered to the question “DO YOU KNOW THE HEALTH BENEFITS OF THESE SUPPLEMENTS?” ANSWER FREQUENCY PERCENTAGE VERY KNOWLEDGEABLE 21 70 KNOWLEDGEABLE 9 30 SLIGHTLY 0 0 KNOWLEDGEABLE NOT KNOWLEDGEABLE 0 0 TOTAL 30 100 WEIGHTEDMEAN 3.7 INTERPRETATION VERY KNOWLEDGEABLE
- 25. As presented on table 45, as 3.7 weighted mean, it shows that female users are very knowledgeable about the health benefits of the food supplements they are taking. Table 46. Frequency and Percentage Distribution of Male Users on what they answered to the question “DO YOU KNOW THE HEALTH BENEFITS OF THESE SUPPLEMENTS?” ANSWER FREQUENCY PERCENTAGE VERY KNOWLEDGEABLE 8 80 KNOWLEDGEABLE 1 1 SLIGHTLY 1 1 KNOWLEDGEABLE NOT KNOWLEDGEABLE 0 0 TOTAL 10 10 WEIGHTEDMEAN 3.7 INTERPRETATION VERY KNOWLEDGEABLE As gleaned on table 46, as 3.7 weighted mean, it shows that male users are very knowledgeable on the health benefits of the food supplements they are taking. It shows that majority of the respondents are very knowledgeable on the health benefits of the food supplements they are taking.