Chapter Five project management in operations research .pdf
- 1. Chapter 5- Project Management Project Network
- 2. Project Management ’ü« What is a project? ’ü« Any endeavor with objectives ’ü« With multiple activities ’ü« With defined precedent relationships ’ü« With a specific time period for completion ’ü« Examples? ’ü« A major event like a wedding ’ü« Any construction project ’ü« Designing a political campaign
- 3. Five Project Life Cycle Phases ’ü« Conception: identify the need ’ü« Feasibility analysis or study: costs benefits, and risks ’ü« Planning: who, how long, what to do? ’ü« Execution: doing the project ’ü« Termination: ending the project
- 4. Network Planning Techniques ’ü« Program Evaluation & Review Technique (PERT): ’ü« Developed to manage the Polaris missile project ’ü« Many tasks pushed the boundaries of science & engineering (tasksŌĆÖ duration = probabilistic) ’ü« Critical Path Method (CPM): ’ü« Developed to coordinate maintenance projects in the chemical industry ’ü« A complex undertaking, but individual tasks are routine (tasksŌĆÖ duration = deterministic)
- 5. Both PERT and CPM ’ü« Graphically display the precedence relationships & sequence of activities ’ü« Estimate the projectŌĆÖs duration ’ü« Identify critical activities that cannot be delayed without delaying the project ’ü« Estimate the amount of slack associated with non- critical activities
- 6. Network Diagrams ’ü« The project network should convey all this information. Two alternative types of project networks are available for doing this. ’ü« One type is the activity-on-arc (AOA) project network, where each activity is represented by an arc. ’ü« A node is used to separate an activity (an outgoing arc) from each of its immediate predecessors (an incoming arc). The sequencing of the arcs thereby shows the precedence relationships between the activities.
- 7. Network Diagrams ’ü« The second type is the activity-on-node (AON) project network, where each activity is represented by a node. ’ü« Then the arcs are used just to show the precedence relationships that exist between the activities. ’ü« In particular, the node for each activity with immediate predecessors has an arc coming in from each of these predecessors.
- 8. Network Diagrams ’ü« The original versions of PERT and CPM used AOA project networks, so this was the conventional type for some years. However, AON project networks have some important advantages over AOA project networks for conveying the same information.
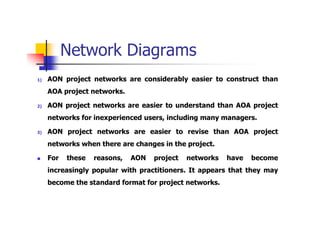
- 9. Network Diagrams 1) AON project networks are considerably easier to construct than AOA project networks. 2) AON project networks are easier to understand than AOA project networks for inexperienced users, including many managers. 3) AON project networks are easier to revise than AOA project networks when there are changes in the project. ’ü« For these reasons, AON project networks have become increasingly popular with practitioners. It appears that they may become the standard format for project networks.
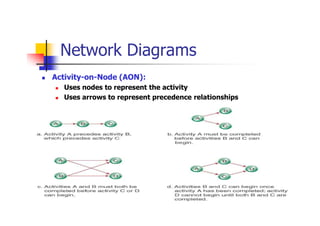
- 10. Network Diagrams ’ü« Activity-on-Node (AON): ’ü« Uses nodes to represent the activity ’ü« Uses arrows to represent precedence relationships
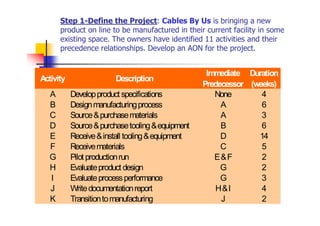
- 11. Step 1-Define the Project: Cables By Us is bringing a new product on line to be manufactured in their current facility in some existing space. The owners have identified 11 activities and their precedence relationships. Develop an AON for the project. Activity Description Immediate Predecessor Duration (weeks) A Developproduct specifications None 4 B Designmanufacturingprocess A 6 C Source&purchasematerials A 3 D Source&purchasetooling&equipment B 6 E Receive&install tooling&equipment D 14 F Receivematerials C 5 G Pilot productionrun E&F 2 H Evaluateproduct design G 2 I Evaluateprocessperformance G 3 J Writedocumentationreport H&I 4 K Transitiontomanufacturing J 2
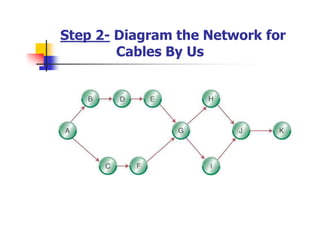
- 12. Step 2- Diagram the Network for Cables By Us
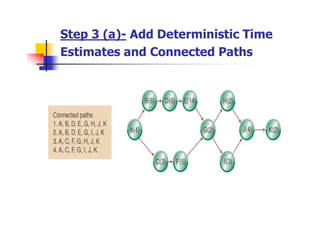
- 13. Step 3 (a)- Add Deterministic Time Estimates and Connected Paths
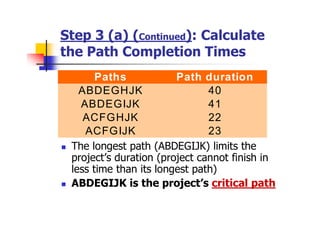
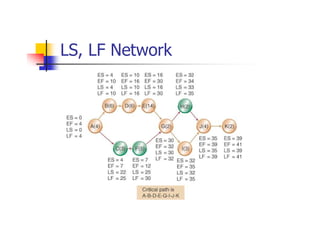
- 14. Step 3 (a) (Continued): Calculate the Path Completion Times ’ü« The longest path (ABDEGIJK) limits the projectŌĆÖs duration (project cannot finish in less time than its longest path) ’ü« ABDEGIJK is the projectŌĆÖs critical path Paths Path duration ABDEGHJK 40 ABDEGIJK 41 ACFGHJK 22 ACFGIJK 23
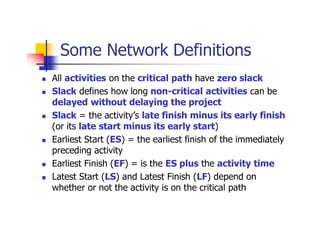
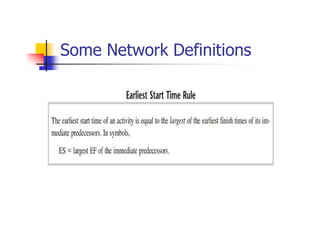
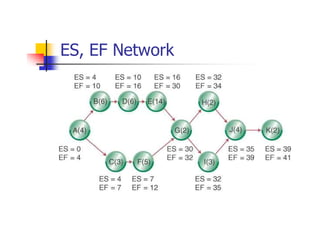
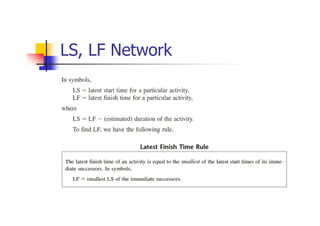
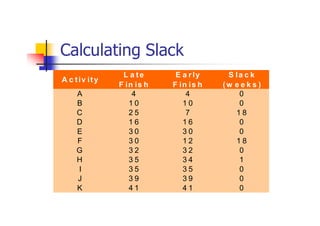
- 15. Some Network Definitions ’ü« All activities on the critical path have zero slack ’ü« Slack defines how long non-critical activities can be delayed without delaying the project ’ü« Slack = the activityŌĆÖs late finish minus its early finish (or its late start minus its early start) ’ü« Earliest Start (ES) = the earliest finish of the immediately preceding activity ’ü« Earliest Finish (EF) = is the ES plus the activity time ’ü« Latest Start (LS) and Latest Finish (LF) depend on whether or not the activity is on the critical path
- 17. ES, EF Network
- 18. LS, LF Network
- 19. LS, LF Network
- 20. LS, LF Network ’ü« Note that the procedure being illustrated above is to start with the final activities and work backward in time toward the initial activities to calculate all the LF and LS values. ’ü« Thus, in contrast to the forward pass used to find earliest start and finish times, we now are making a backward pass through the network.
- 21. Calculating Slack A c tiv ity L a te F in is h E a r ly F in is h S la c k (w e e k s ) A 4 4 0 B 1 0 1 0 0 C 2 5 7 1 8 D 1 6 1 6 0 E 3 0 3 0 0 F 3 0 1 2 1 8 G 3 2 3 2 0 H 3 5 3 4 1 I 3 5 3 5 0 J 3 9 3 9 0 K 4 1 4 1 0
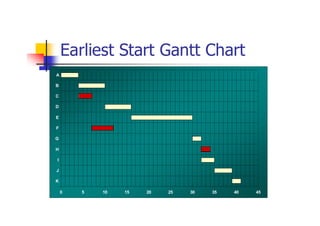
- 22. Earliest Start Gantt Chart 0 5 10 15 20 25 30 35 40 45 K J I H G F E D C B A
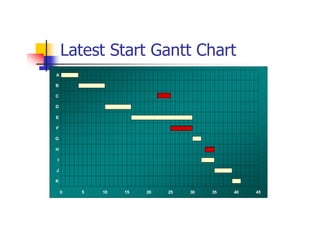
- 23. Latest Start Gantt Chart 0 5 10 15 20 25 30 35 40 45 K J I H G F E D C B A
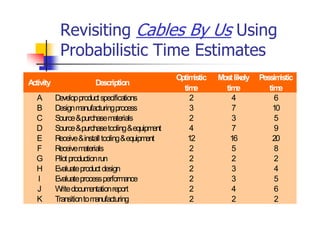
- 24. Revisiting Cables By Us Using Probabilistic Time Estimates A ctivity Description Optim istic tim e M ostlikely tim e Pessim istic tim e A Developproductspecifications 2 4 6 B Designm anufacturingprocess 3 7 10 C Source&purchasem aterials 2 3 5 D Source&purchasetooling&equipm ent 4 7 9 E Receive&installtooling&equipm ent 12 16 20 F Receivem aterials 2 5 8 G Pilotproductionrun 2 2 2 H Evaluateproductdesign 2 3 4 I Evaluateprocessperform ance 2 3 5 J W ritedocum entationreport 2 4 6 K Transitiontom anufacturing 2 2 2
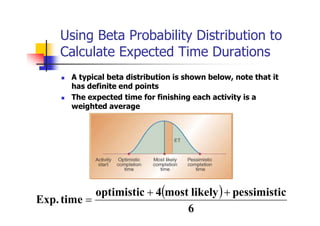
- 25. Using Beta Probability Distribution to Calculate Expected Time Durations ’ü« A typical beta distribution is shown below, note that it has definite end points ’ü« The expected time for finishing each activity is a weighted average ’Ć© ’Ć® 6 c pessimisti likely most 4 optimistic time Exp. ’Ć½ ’Ć½ ’ĆĮ
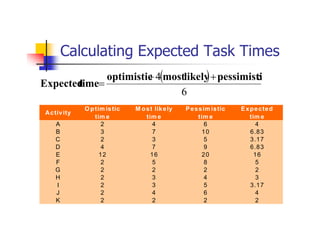
- 26. Calculating Expected Task Times Activity O ptim istic tim e M ost likely tim e Pessim istic tim e Expected tim e A 2 4 6 4 B 3 7 10 6.83 C 2 3 5 3.17 D 4 7 9 6.83 E 12 16 20 16 F 2 5 8 5 G 2 2 2 2 H 2 3 4 3 I 2 3 5 3.17 J 2 4 6 4 K 2 2 2 2 ’Ć© ’Ć® 6 4 c pessimisti likely most optimistic time Expected ’Ć½ ’Ć½ ’ĆĮ
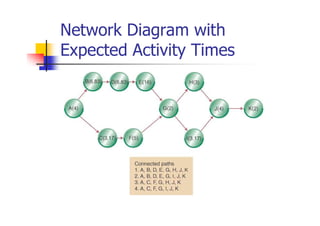
- 27. Network Diagram with Expected Activity Times
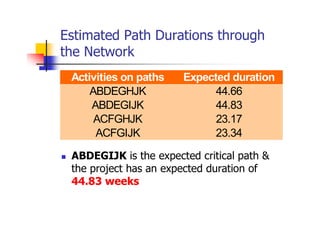
- 28. Estimated Path Durations through the Network ’ü« ABDEGIJK is the expected critical path & the project has an expected duration of 44.83 weeks Activities on paths Expected duration ABDEGHJK 44.66 ABDEGIJK 44.83 ACFGHJK 23.17 ACFGIJK 23.34
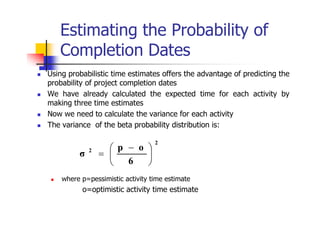
- 29. Estimating the Probability of Completion Dates ’ü« Using probabilistic time estimates offers the advantage of predicting the probability of project completion dates ’ü« We have already calculated the expected time for each activity by making three time estimates ’ü« Now we need to calculate the variance for each activity ’ü« The variance of the beta probability distribution is: ’ü« where p=pessimistic activity time estimate o=optimistic activity time estimate 2 2 6 o p Žā ’āĘ ’āĖ ’āČ ’ā¦ ’ā© ’ā” ’ĆŁ ’ĆĮ
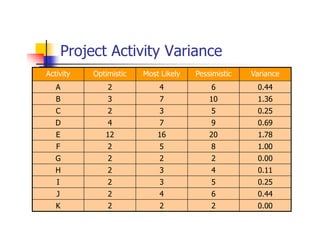
- 30. Project Activity Variance Activity Optimistic Most Likely Pessimistic Variance A 2 4 6 0.44 B 3 7 10 1.36 C 2 3 5 0.25 D 4 7 9 0.69 E 12 16 20 1.78 F 2 5 8 1.00 G 2 2 2 0.00 H 2 3 4 0.11 I 2 3 5 0.25 J 2 4 6 0.44 K 2 2 2 0.00
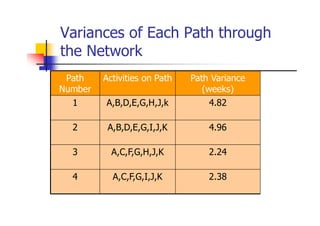
- 31. Variances of Each Path through the Network Path Number Activities on Path Path Variance (weeks) 1 A,B,D,E,G,H,J,k 4.82 2 A,B,D,E,G,I,J,K 4.96 3 A,C,F,G,H,J,K 2.24 4 A,C,F,G,I,J,K 2.38
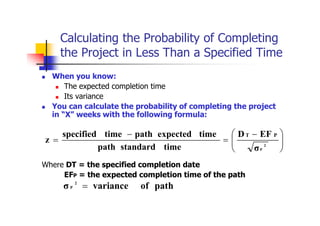
- 32. Calculating the Probability of Completing the Project in Less Than a Specified Time ’ü« When you know: ’ü« The expected completion time ’ü« Its variance ’ü« You can calculate the probability of completing the project in ŌĆ£XŌĆØ weeks with the following formula: Where DT = the specified completion date EFP = the expected completion time of the path ’āĘ ’āĘ ’āĖ ’āČ ’ā¦ ’ā¦ ’ā© ’ā” ’ĆŁ ’ĆĮ ’ĆŁ ’ĆĮ 2 P Žā EF D time standard path time expected path time specified z P T path of variance Žā 2 P ’ĆĮ
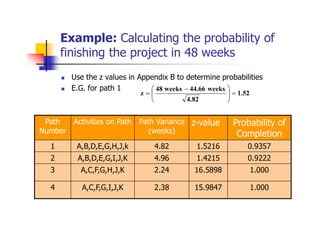
- 33. Example: Calculating the probability of finishing the project in 48 weeks ’ü« Use the z values in Appendix B to determine probabilities ’ü« E.G. for path 1 Path Number Activities on Path Path Variance (weeks) z-value Probability of Completion 1 A,B,D,E,G,H,J,k 4.82 1.5216 0.9357 2 A,B,D,E,G,I,J,K 4.96 1.4215 0.9222 3 A,C,F,G,H,J,K 2.24 16.5898 1.000 4 A,C,F,G,I,J,K 2.38 15.9847 1.000 1.52 4.82 weeks 44.66 weeks 48 z ’ĆĮ ’āĘ ’āĘ ’āĖ ’āČ ’ā¦ ’ā¦ ’ā© ’ā” ’ĆŁ ’ĆĮ
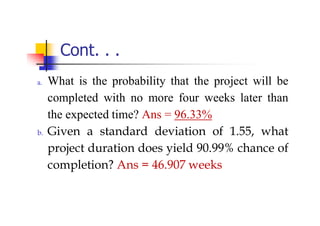
- 34. Cont. . . a. What is the probability that the project will be completed with no more four weeks later than the expected time? Ans = 96.33% b. Given a standard deviation of 1.55, what project duration does yield 90.99% chance of completion? Ans = 46.907 weeks
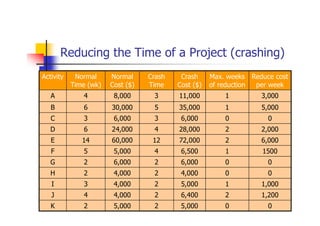
- 35. Reducing the Time of a Project (crashing) Activity Normal Time (wk) Normal Cost ($) Crash Time Crash Cost ($) Max. weeks of reduction Reduce cost per week A 4 8,000 3 11,000 1 3,000 B 6 30,000 5 35,000 1 5,000 C 3 6,000 3 6,000 0 0 D 6 24,000 4 28,000 2 2,000 E 14 60,000 12 72,000 2 6,000 F 5 5,000 4 6,500 1 1500 G 2 6,000 2 6,000 0 0 H 2 4,000 2 4,000 0 0 I 3 4,000 2 5,000 1 1,000 J 4 4,000 2 6,400 2 1,200 K 2 5,000 2 5,000 0 0
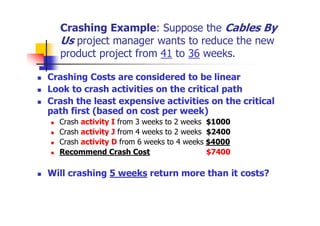
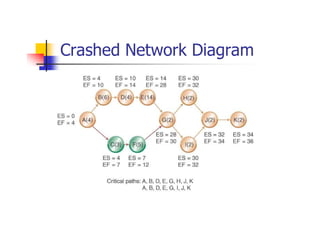
- 36. Crashing Example: Suppose the Cables By Us project manager wants to reduce the new product project from 41 to 36 weeks. ’ü« Crashing Costs are considered to be linear ’ü« Look to crash activities on the critical path ’ü« Crash the least expensive activities on the critical path first (based on cost per week) ’ü« Crash activity I from 3 weeks to 2 weeks $1000 ’ü« Crash activity J from 4 weeks to 2 weeks $2400 ’ü« Crash activity D from 6 weeks to 4 weeks $4000 ’ü« Recommend Crash Cost $7400 ’ü« Will crashing 5 weeks return more than it costs?