Chapter Ratio Analysis.pptx
Download as pptx, pdf0 likes37 views

Ratio analysis involves calculating financial ratios to analyze a firm's performance. There are several categories of ratios, including liquidity ratios, activity ratios, debt ratios, profitability ratios, and market ratios. Liquidity ratios measure a firm's ability to meet short-term obligations, activity ratios measure how efficiently a firm uses its assets, debt ratios indicate the degree of a firm's financial leverage, profitability ratios evaluate profits relative to sales and assets, and market ratios relate market value to accounting values. Ratio analysis provides insights into a firm's financial health and performance.
Chapter Ratio Analysis.pptx
- 1. Ratio Analysis Involves methods of calculating and interpreting financial ratios to analyze and monitor the firmÔÇÖs performance. 1
- 2. Interested Parties ´â╝ Shareholders ´â╝ Creditors ´â╝ FirmÔÇÖs own management 2
- 3. Categories of Financial Ratios Liquidity ratios Activity ratios Debt ratios Profitability ratios Market ratios 3
- 4. Ratio Analysis A. Liquidity ratios Ôùª ratios that relates the firmÔÇÖs cash and other assets to its current liabilities ´éù Liquid asset Ôùª an asset that can be easily converted into cash without significant loss of its original value 4
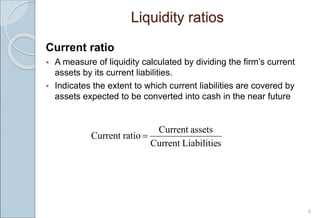
- 5. 5 Current ratio ´éº A measure of liquidity calculated by dividing the firmÔÇÖs current assets by its current liabilities. ´éº Indicates the extent to which current liabilities are covered by assets expected to be converted into cash in the near future s Liabilitie Current assets Current ratio Current ´Ç¢ Liquidity ratios
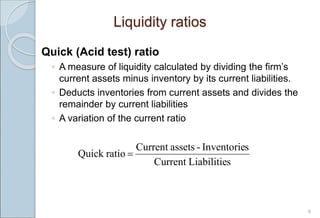
- 6. 6 Liquidity ratios Quick (Acid test) ratio Ôùª A measure of liquidity calculated by dividing the firmÔÇÖs current assets minus inventory by its current liabilities. Ôùª Deducts inventories from current assets and divides the remainder by current liabilities Ôùª A variation of the current ratio s Liabilitie Current s Inventorie - assets Current ratio Quick ´Ç¢
- 7. Ratio Analysis 7 B. Activity Ratios ´éº Measure the speed with which various accounts are converted into sales or cash, or inflows or outflows ´éº Ratios that measure how effectively a firm is managing its assets
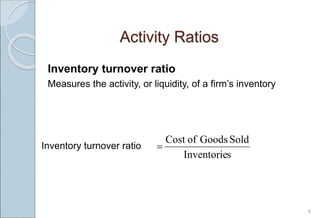
- 8. Activity Ratios Inventory turnover ratio Measures the activity, or liquidity, of a firmÔÇÖs inventory 8 s Inventorie Sold Goods of Cost ´Ç¢ Inventory turnover ratio
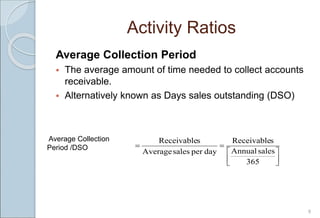
- 9. Activity Ratios Average Collection Period ´éº The average amount of time needed to collect accounts receivable. ´éº Alternatively known as Days sales outstanding (DSO) 9 ´â║ ´â╗ ´â╣ ´â¬ ´â½ ´â® ´Ç¢ ´Ç¢ 365 sales Annual s Receivable day per sales Average s Receivable Average Collection Period /DSO
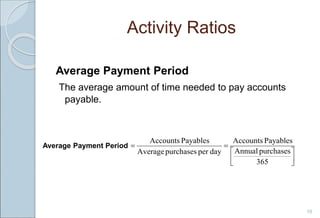
- 10. Activity Ratios Average Payment Period The average amount of time needed to pay accounts payable. 10 ´â║ ´â╗ ´â╣ ´â¬ ´â½ ´â® ´Ç¢ ´Ç¢ 365 purchases Annual Payables Accounts day per purchases Average Payables Accounts Average Payment Period
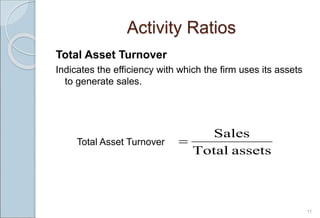
- 11. Total Asset Turnover Indicates the efficiency with which the firm uses its assets to generate sales. 11 Activity Ratios assets Total Sales ´Ç¢ Total Asset Turnover
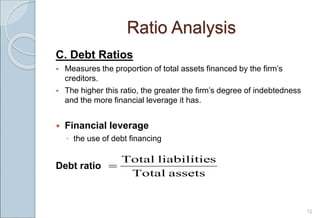
- 12. C. Debt Ratios ´éº Measures the proportion of total assets financed by the firmÔÇÖs creditors. ´éº The higher this ratio, the greater the firmÔÇÖs degree of indebtedness and the more financial leverage it has. ´éù Financial leverage Ôùª the use of debt financing Debt ratio 12 Ratio Analysis assets Total s liabilitie Total ´Ç¢
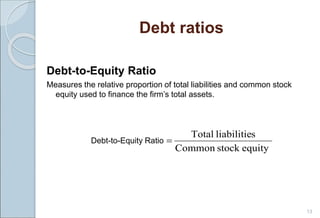
- 13. Debt ratios Debt-to-Equity Ratio Measures the relative proportion of total liabilities and common stock equity used to finance the firmÔÇÖs total assets. 13 equity stock Common s liabilitie Total ´Ç¢ Debt-to-Equity Ratio
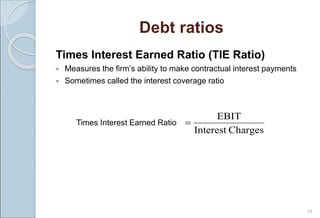
- 14. Debt ratios Times Interest Earned Ratio (TIE Ratio) ´éº Measures the firmÔÇÖs ability to make contractual interest payments ´éº Sometimes called the interest coverage ratio 14 Charges Interest EBIT ´Ç¢ Times Interest Earned Ratio
- 15. Ratio Analysis D. Profitability Ratios These ratios enable analysts to evaluate the firmÔÇÖs profits with respect to a given level of sales, a certain level of assets, or the ownersÔÇÖ investment. 15
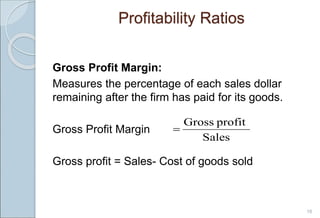
- 16. Profitability Ratios Gross Profit Margin: Measures the percentage of each sales dollar remaining after the firm has paid for its goods. Gross Profit Margin Gross profit = Sales- Cost of goods sold 16 Sales profit Gross ´Ç¢
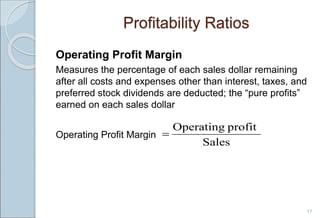
- 17. Operating Profit Margin Measures the percentage of each sales dollar remaining after all costs and expenses other than interest, taxes, and preferred stock dividends are deducted; the ÔÇ£pure profitsÔÇØ earned on each sales dollar Operating Profit Margin 17 Profitability Ratios Sales profit Operating ´Ç¢
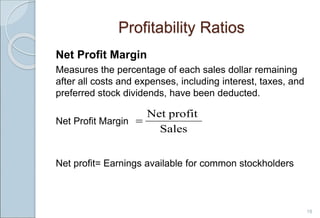
- 18. Profitability Ratios Net Profit Margin Measures the percentage of each sales dollar remaining after all costs and expenses, including interest, taxes, and preferred stock dividends, have been deducted. Net Profit Margin Net profit= Earnings available for common stockholders 18 Sales profit Net ´Ç¢
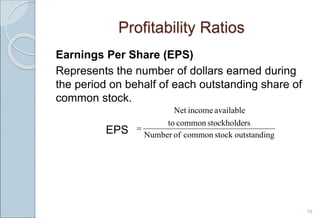
- 19. Profitability Ratios Earnings Per Share (EPS) Represents the number of dollars earned during the period on behalf of each outstanding share of common stock. EPS 19 g outstandin stock common of Number rs stockholde common to available income Net ´Ç¢
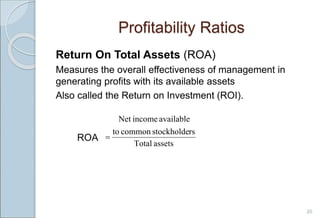
- 20. Profitability Ratios Return On Total Assets (ROA) Measures the overall effectiveness of management in generating profits with its available assets Also called the Return on Investment (ROI). ROA 20 assets Total rs stockholde common to available income Net ´Ç¢
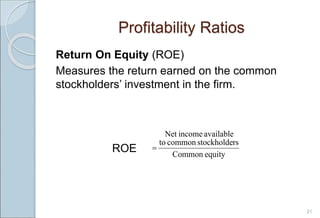
- 21. Profitability Ratios Return On Equity (ROE) Measures the return earned on the common stockholdersÔÇÖ investment in the firm. ROE 21 equity Common rs stockholde common to available income Net ´Ç¢
- 22. Ratio Analysis E. Market Ratios Relate a firmÔÇÖs market value, as measured by its current share price, to certain accounting values. 22
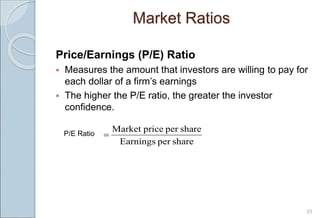
- 23. Market Ratios Price/Earnings (P/E) Ratio ´éº Measures the amount that investors are willing to pay for each dollar of a firmÔÇÖs earnings ´éº The higher the P/E ratio, the greater the investor confidence. P/E Ratio 23 share per Earnings share per price Market ´Ç¢
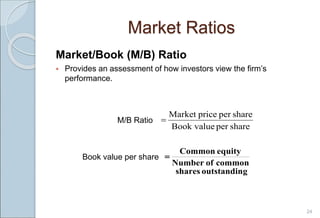
- 24. Market Ratios Market/Book (M/B) Ratio ´éº Provides an assessment of how investors view the firmÔÇÖs performance. M/B Ratio Book value per share 24 share per Book value share per price Market ´Ç¢ g outstandin shares common of Number equity Common ´Ç¢