


More Related Content
Similar to chapter5.pptx (20)
Recently uploaded (20)


chapter5.pptx
- 1. Fundamentals of Multimedia Chapter 5 : Fundamental Concepts in Video 2nd Edition 2014 Ze-Nian Li Mark S. Drew Jiangchuan Liu 1
- 2. ÔÇó This chapter explores: ÔÇß the principal notions needed to understand video ÔÇó in this chapter we shall consider the following aspects of video and how they impact multimedia applications: ÔÇó Analog video ÔÇó Digital video ÔÇó Video display interfaces ÔÇó 3D video 2
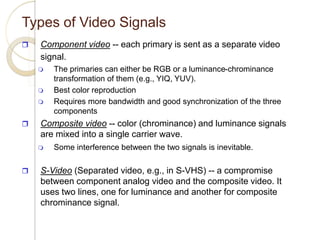
- 3. Types of Video Signals  Component video -- each primary is sent as a separate video signal.  The primaries can either be RGB or a luminance-chrominance transformation of them (e.g., YIQ, YUV).  Best color reproduction  Requires more bandwidth and good synchronization of the three components  Composite video -- color (chrominance) and luminance signals are mixed into a single carrier wave.  Some interference between the two signals is inevitable.  S-Video (Separated video, e.g., in S-VHS) -- a compromise between component analog video and the composite video. It uses two lines, one for luminance and another for composite chrominance signal.
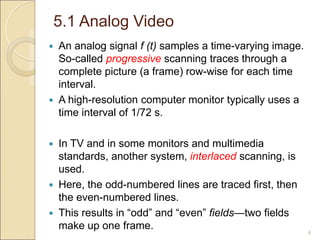
- 4. 5.1 Analog Video  An analog signal f (t) samples a time-varying image. So-called progressive scanning traces through a complete picture (a frame) row-wise for each time interval.  A high-resolution computer monitor typically uses a time interval of 1/72 s.  In TV and in some monitors and multimedia standards, another system, interlaced scanning, is used.  Here, the odd-numbered lines are traced first, then the even-numbered lines.  This results in “odd” and “even” fields—two fields make up one frame. 4
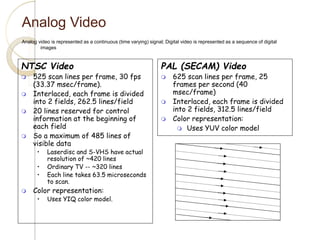
- 5. Analog Video Analog video is represented as a continuous (time varying) signal; Digital video is represented as a sequence of digital images NTSC Video  525 scan lines per frame, 30 fps (33.37 msec/frame).  Interlaced, each frame is divided into 2 fields, 262.5 lines/field  20 lines reserved for control information at the beginning of each field  So a maximum of 485 lines of visible data • Laserdisc and S-VHS have actual resolution of ~420 lines • Ordinary TV -- ~320 lines • Each line takes 63.5 microseconds to scan.  Color representation: • Uses YIQ color model. PAL (SECAM) Video  625 scan lines per frame, 25 frames per second (40 msec/frame)  Interlaced, each frame is divided into 2 fields, 312.5 lines/field  Color representation:  Uses YUV color model
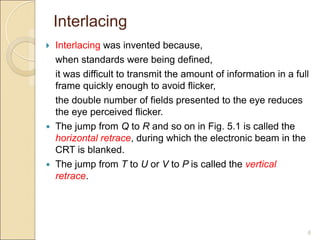
- 6. Interlacing ÔÅΩ Interlacing was invented because, when standards were being defined, it was difficult to transmit the amount of information in a full frame quickly enough to avoid flicker, the double number of fields presented to the eye reduces the eye perceived flicker. ÔÇó The jump from Q to R and so on in Fig. 5.1 is called the horizontal retrace, during which the electronic beam in the CRT is blanked. ÔÇó The jump from T to U or V to P is called the vertical retrace. 6
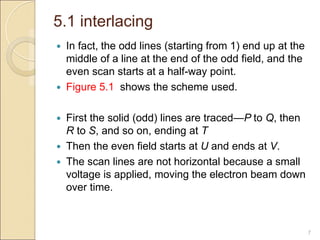
- 7. 5.1 interlacing 7  In fact, the odd lines (starting from 1) end up at the middle of a line at the end of the odd field, and the even scan starts at a half-way point.  Figure 5.1 shows the scheme used.  First the solid (odd) lines are traced—P to Q, then R to S, and so on, ending at T  Then the even field starts at U and ends at V.  The scan lines are not horizontal because a small voltage is applied, moving the electron beam down over time.
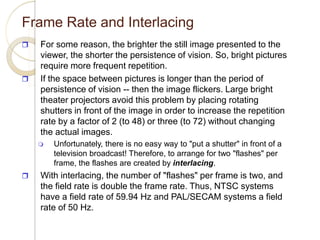
- 8. Frame Rate and Interlacing  Persistence of vision: The human eye retains an image for a fraction of a second after it views the image. This property is essential to all visual display technologies.  The basic idea is quite simple, single still frames are presented at a high enough rate so that persistence of vision integrates these still frames into motion.  Motion pictures originally set the frame rate at 16 frames per second. This was rapidly found to be unacceptable and the frame rate was increased to 24 frames per second. In Europe, this was changed to 25 frames per second, as the European power line frequency is 50 Hz.  When NTSC television standards were introduced, the frame rate was set at 30 Hz (1/2 the 60 Hz line frequency). Movies filmed at 24 frames per second are simply converted to 30 frames per second on television broadcasting.
- 9. Frame Rate and Interlacing  For some reason, the brighter the still image presented to the viewer, the shorter the persistence of vision. So, bright pictures require more frequent repetition.  If the space between pictures is longer than the period of persistence of vision -- then the image flickers. Large bright theater projectors avoid this problem by placing rotating shutters in front of the image in order to increase the repetition rate by a factor of 2 (to 48) or three (to 72) without changing the actual images.  Unfortunately, there is no easy way to "put a shutter" in front of a television broadcast! Therefore, to arrange for two "flashes" per frame, the flashes are created by interlacing.  With interlacing, the number of "flashes" per frame is two, and the field rate is double the frame rate. Thus, NTSC systems have a field rate of 59.94 Hz and PAL/SECAM systems a field rate of 50 Hz.
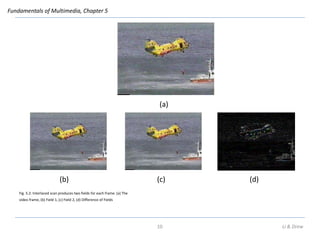
- 10. Fundamentals of Multimedia, Chapter 5 Fig. 5.2: Interlaced scan produces two fields for each frame. (a) The video frame, (b) Field 1, (c) Field 2, (d) Difference of Fields (a) (b) (c) (d) 10 Li & Drew
- 11. 5.1.1 NTSC Video 11  NTSC stands for (National Television System Committee of the U.S.A)  The NTSC TV standard is mostly used in North America and Japan.  It uses a familiar 4:3 aspect ratio (i.e., the ratio of picture width to height) and 525 (interlaced) scan lines per frame at 30 fps.  Figure 5.4 shows the effect of “vertical retrace and sync” and “horizontal retrace and sync” on the NTSC video raster.
- 12. 5.1.1 NTSC Video 12  Figure 5.4 shows the effect of “vertical retrace and sync” and “horizontal retrace and sync” on the NTSC video raster.  Blanking information is placed into 20 lines reserved for control information at the beginning of each field.  Hence, the number of active video lines per frame is only 485.  Similarly, almost 1/6 of the raster at the left side is blanked for horizontal retrace and sync.  The nonblanking pixels are called active pixels.  Image data is not encoded in the blanking regions, but other information can be placed there, such as V-chip information, stereo audio channel data, and subtitles in many languages.
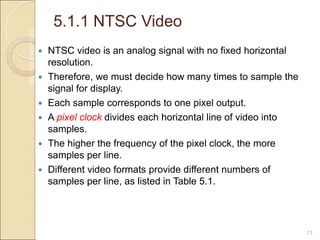
- 13. 5.1.1 NTSC Video 13 ÔÇó NTSC video is an analog signal with no fixed horizontal resolution. ÔÇó Therefore, we must decide how many times to sample the signal for display. ÔÇó Each sample corresponds to one pixel output. ÔÇó A pixel clock divides each horizontal line of video into samples. ÔÇó The higher the frequency of the pixel clock, the more samples per line. ÔÇó Different video formats provide different numbers of samples per line, as listed in Table 5.1.
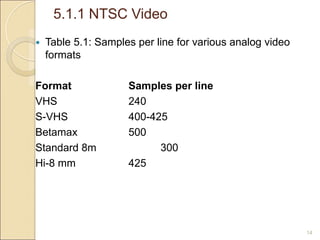
- 14. 5.1.1 NTSC Video 14 ÔÇó Table 5.1: Samples per line for various analog video formats Format Samples per line VHS 240 S-VHS 400-425 Betamax 500 Standard 8m 300 Hi-8 mm 425
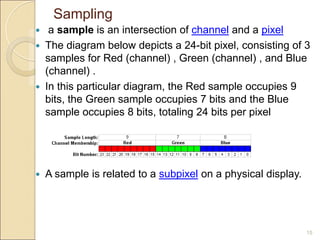
- 15. Sampling 15 ÔÇó a sample is an intersection of channel and a pixel ÔÇó The diagram below depicts a 24-bit pixel, consisting of 3 samples for Red (channel) , Green (channel) , and Blue (channel) . ÔÇó In this particular diagram, the Red sample occupies 9 bits, the Green sample occupies 7 bits and the Blue sample occupies 8 bits, totaling 24 bits per pixel ÔÇó A sample is related to a subpixel on a physical display.
- 16. Vertical Trace 16 ÔÇó Alternatively referred to as a vertical blanking interval or the vertical sync signal, vertical retrace is used to describe the action performed within the computer monitor that turns the monitor beam off when moving it from the lower-right corner of a monitor to the upper-left of the monitor. ÔÇó This action takes place each time the beam has completed tracing the entire screen to create an image.
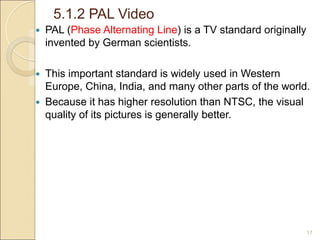
- 17. 5.1.2 PAL Video 17 ÔÇó PAL (Phase Alternating Line) is a TV standard originally invented by German scientists. ÔÇó This important standard is widely used in Western Europe, China, India, and many other parts of the world. ÔÇó Because it has higher resolution than NTSC, the visual quality of its pictures is generally better.
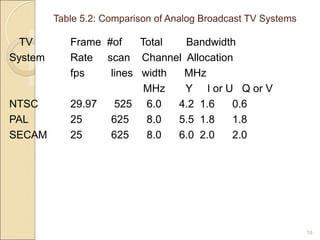
- 18. Table 5.2: Comparison of Analog Broadcast TV Systems 18 TV Frame #of Total Bandwidth System Rate scan Channel Allocation fps lines width MHz MHz Y I or U Q or V NTSC 29.97 525 6.0 4.2 1.6 0.6 PAL 25 625 8.0 5.5 1.8 1.8 SECAM 25 625 8.0 6.0 2.0 2.0
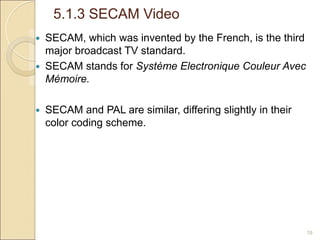
- 19. 5.1.3 SECAM Video 19  SECAM, which was invented by the French, is the third major broadcast TV standard.  SECAM stands for Système Electronique Couleur Avec Mémoire.  SECAM and PAL are similar, differing slightly in their color coding scheme.
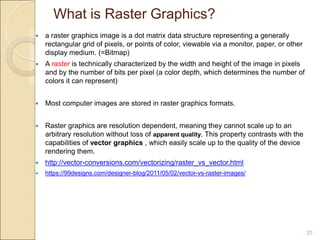
- 20. What is Raster Graphics? 20 ÔÇó a raster graphics image is a dot matrix data structure representing a generally rectangular grid of pixels, or points of color, viewable via a monitor, paper, or other display medium. (=Bitmap) ÔÇó A raster is technically characterized by the width and height of the image in pixels and by the number of bits per pixel (a color depth, which determines the number of colors it can represent) ÔÇó Most computer images are stored in raster graphics formats. ÔÇó Raster graphics are resolution dependent, meaning they cannot scale up to an arbitrary resolution without loss of apparent quality. This property contrasts with the capabilities of vector graphics , which easily scale up to the quality of the device rendering them. ÔÇó http://vector-conversions.com/vectorizing/raster_vs_vector.html ÔÇó https://99designs.com/designer-blog/2011/05/02/vector-vs-raster-images/
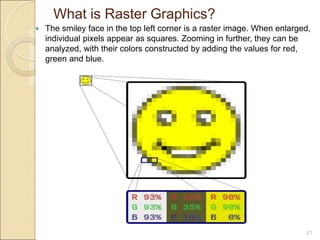
- 21. What is Raster Graphics? 21 ÔÇó The smiley face in the top left corner is a raster image. When enlarged, individual pixels appear as squares. Zooming in further, they can be analyzed, with their colors constructed by adding the values for red, green and blue.
- 22. 5.2 Digital Video 22 ÔÇó The advantages of digital representation for video: ‚ó¶ Storing video on digital devices or in memory, ready to be processed (noise removal, cut and paste, and so on) and integrated into various multimedia applications. ‚ó¶ Direct access, which makes nonlinear video editing simple. ‚ó¶ Repeated recording without degradation of image quality. ‚ó¶ Ease of encryption and better tolerance to channel noise.
- 23. 5.2.2 CCIR and ITU-R Standards for Digital Video 23 ÔÇó The CCIR is the Consultative Committee for International Radio. ÔÇó One of the most important standards it has produced is CCIR-601 for component digital video. ÔÇó This standard has since become standard ITU-R Rec. 601, an international standard for professional video applications. ÔÇó It is adopted by several digital video formats, including the popular DV video.
- 24. 5.2.2 CCIR and ITU-R Standards for Digital Video 24 ÔÇó CIF stands for Common Intermediate Format, specified by the International Telegraph and Telephone Consultative Committee (CCITT) ÔÇó now superseded by the International Telecommunication Union, which oversees both telecommunications (ITU-T) and radio frequency matters (ITU-R) under one United Nations body ÔÇó The idea of CIF, which is about the same as VHS quality, is to specify a format for lower bitrate. ÔÇó CIF uses a progressive (noninterlaced) scan. ÔÇó QCIF stands for Quarter-CIF, and is for even lower bitrate.
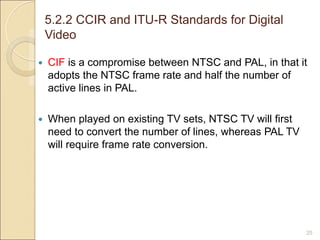
- 25. 5.2.2 CCIR and ITU-R Standards for Digital Video 25 ÔÇó CIF is a compromise between NTSC and PAL, in that it adopts the NTSC frame rate and half the number of active lines in PAL. ÔÇó When played on existing TV sets, NTSC TV will first need to convert the number of lines, whereas PAL TV will require frame rate conversion.
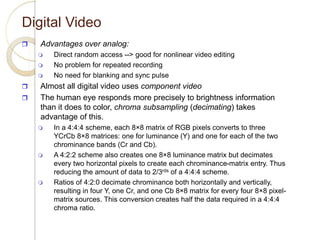
- 26. Digital Video  Advantages over analog:  Direct random access --> good for nonlinear video editing  No problem for repeated recording  No need for blanking and sync pulse  Almost all digital video uses component video  The human eye responds more precisely to brightness information than it does to color, chroma subsampling (decimating) takes advantage of this.  In a 4:4:4 scheme, each 8×8 matrix of RGB pixels converts to three YCrCb 8×8 matrices: one for luminance (Y) and one for each of the two chrominance bands (Cr and Cb).  A 4:2:2 scheme also creates one 8×8 luminance matrix but decimates every two horizontal pixels to create each chrominance-matrix entry. Thus reducing the amount of data to 2/3rds of a 4:4:4 scheme.  Ratios of 4:2:0 decimate chrominance both horizontally and vertically, resulting in four Y, one Cr, and one Cb 8×8 matrix for every four 8×8 pixel- matrix sources. This conversion creates half the data required in a 4:4:4 chroma ratio.
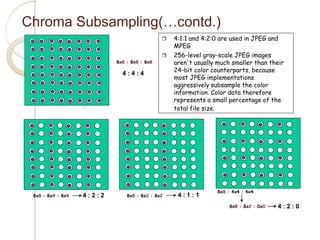
- 27. Chroma Subsampling(…contd.)  4:1:1 and 4:2:0 are used in JPEG and MPEG  256-level gray-scale JPEG images aren't usually much smaller than their 24-bit color counterparts, because most JPEG implementations aggressively subsample the color information. Color data therefore represents a small percentage of the total file size. 8x8 : 8x8 : 8x8 4 : 2 : 2 4 : 1 : 1 4 : 2 : 0 4 : 4 : 4 8x8 : 8x4 : 8x4 8x8 : 8x2 : 8x2 8x8 : 4x4 : 4x4 8x8 : 8x2 : 0x0
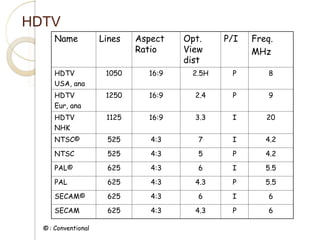
- 28. HDTV Name Lines Aspect Ratio Opt. View dist P/I Freq. MHz HDTV USA, ana 1050 16:9 2.5H P 8 HDTV Eur, ana 1250 16:9 2.4 P 9 HDTV NHK 1125 16:9 3.3 I 20 NTSC© 525 4:3 7 I 4.2 NTSC 525 4:3 5 P 4.2 PAL© 625 4:3 6 I 5.5 PAL 625 4:3 4.3 P 5.5 SECAM© 625 4:3 6 I 6 SECAM 625 4:3 4.3 P 6 ©: Conventional
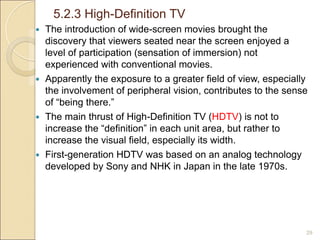
- 29. 5.2.3 High-Definition TV 29  The introduction of wide-screen movies brought the discovery that viewers seated near the screen enjoyed a level of participation (sensation of immersion) not experienced with conventional movies.  Apparently the exposure to a greater field of view, especially the involvement of peripheral vision, contributes to the sense of “being there.”  The main thrust of High-Definition TV (HDTV) is not to increase the “definition” in each unit area, but rather to increase the visual field, especially its width.  First-generation HDTV was based on an analog technology developed by Sony and NHK in Japan in the late 1970s.
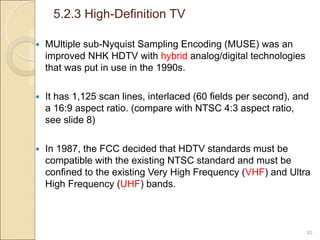
- 30. 5.2.3 High-Definition TV 30 ÔÇó MUltiple sub-Nyquist Sampling Encoding (MUSE) was an improved NHK HDTV with hybrid analog/digital technologies that was put in use in the 1990s. ÔÇó It has 1,125 scan lines, interlaced (60 fields per second), and a 16:9 aspect ratio. (compare with NTSC 4:3 aspect ratio, see slide 8) ÔÇó In 1987, the FCC decided that HDTV standards must be compatible with the existing NTSC standard and must be confined to the existing Very High Frequency (VHF) and Ultra High Frequency (UHF) bands.
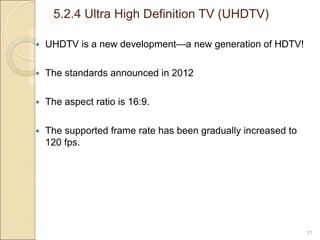
- 31. 5.2.4 Ultra High Definition TV (UHDTV) 31  UHDTV is a new development—a new generation of HDTV!  The standards announced in 2012  The aspect ratio is 16:9.  The supported frame rate has been gradually increased to 120 fps.
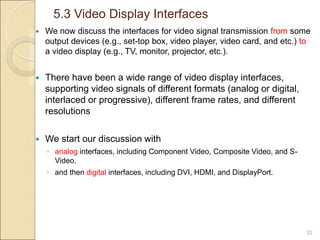
- 32. 5.3 Video Display Interfaces 32 ÔÇó We now discuss the interfaces for video signal transmission from some output devices (e.g., set-top box, video player, video card, and etc.) to a video display (e.g., TV, monitor, projector, etc.). ÔÇó There have been a wide range of video display interfaces, supporting video signals of different formats (analog or digital, interlaced or progressive), different frame rates, and different resolutions ÔÇó We start our discussion with ‚ó¶ analog interfaces, including Component Video, Composite Video, and S- Video, ‚ó¶ and then digital interfaces, including DVI, HDMI, and DisplayPort.
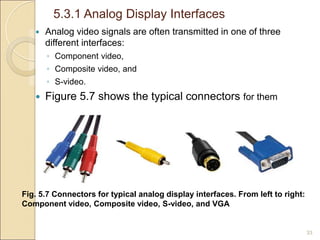
- 33. 5.3.1 Analog Display Interfaces 33 ÔÇó Analog video signals are often transmitted in one of three different interfaces: ‚ó¶ Component video, ‚ó¶ Composite video, and ‚ó¶ S-video. ÔÇó Figure 5.7 shows the typical connectors for them Fig. 5.7 Connectors for typical analog display interfaces. From left to right: Component video, Composite video, S-video, and VGA
- 34. 5.3.1 Analog Display Interfaces 34 ÔÇó Component Video ÔÇó Higher end video systems, such as for studios, make use of three separate video signals for the red, green, and blue image planes. ÔÇó This is referred to as component video. ÔÇó This kind of system has three wires (and connectors) connecting the camera or other devices to a TV or monitor.
- 35. 5.3.1 Analog Display Interfaces 35  S-Video  As a compromise, S-video (separated video, or super-video, e.g., in S- VHS) uses two wires: one for luminance and another for a composite chrominance signal.  The reason for placing luminance into its own part of the signal is that black-and white information is most important for visual perception.  As noted in the previous chapter, humans are able to differentiate spatial resolution in the grayscale (“black and-white”) part much better than for the color part of RGB images.  Therefore, color information transmitted can be much less accurate than intensity information.  We can see only fairly large blobs (‫)نقاط‬ of color, so it makes sense to send less color detail.
- 36. 5.3.1 Analog Display Interfaces 36 ÔÇó Video Graphics Array (VGA) ÔÇó The Video Graphics Array (VGA) is a video display interface that was first introduced by IBM in 1987, along with its PS/2 personal computers. It has since been widely used in the computer industry with many variations, which are collectively referred to as VGA. ÔÇó The initial VGA resolution was 640√ó480 pixels. ÔÇó The VGA video signals are based on analog component RGBHV (red, green, blue, horizontal sync, vertical sync).
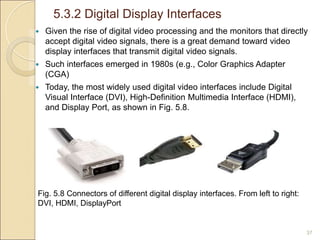
- 37. 5.3.2 Digital Display Interfaces 37 ÔÇó Given the rise of digital video processing and the monitors that directly accept digital video signals, there is a great demand toward video display interfaces that transmit digital video signals. ÔÇó Such interfaces emerged in 1980s (e.g., Color Graphics Adapter (CGA) ÔÇó Today, the most widely used digital video interfaces include Digital Visual Interface (DVI), High-Definition Multimedia Interface (HDMI), and Display Port, as shown in Fig. 5.8. Fig. 5.8 Connectors of different digital display interfaces. From left to right: DVI, HDMI, DisplayPort
- 38. 5.3.1 Analog Display Interfaces 38 ÔÇó Composite Video ÔÇó When connecting to TVs or VCRs, composite video uses only one wire (and hence one connector, such as a BNC connector at each end of a coaxial cable or an RCA plug at each end of an ordinary wire), and video color signals are mixed, not sent separately. ÔÇó The audio signal is another addition to this one signal.
- 39. 5.3.2 Digital Display Interfaces 39  Digital Visual Interface (DVI)  Digital Visual Interface (DVI) was developed by the Digital Display Working Group (DDWG) for transferring digital video signals, particularly from a computer’s video card to a monitor.  It carries uncompressed digital video and can be configured to support multiple modes, including DVI-D (digital only), DVI- A (analog only), or DVI-I (digital and analog).  The support for analog connections makes DVI backward compatible with VGA (though an adapter is needed between the two interfaces).  The DVI allows a maximum 16:9 screen resolution of 1920×1080 pixels.
- 40. 5.3.2 Digital Display Interfaces 40  High-Definition Multimedia Interface (HDMI)  HDMI is a newer digital audio/video interface developed to be backward-compatible with DVI.  HDMI, however, differs from DVI in the following aspects: 1. HDMI does not carry analog signal and hence is not compatible with VGA. 2. DVI is limited to the RGB color range (0–255). 3. HDMI supports digital audio, in addition to digital video.  The HDMI allows a maximum screen resolution of 2560×1600 pixels. 2, 560×1, 600
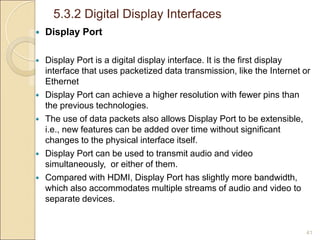
- 41. 5.3.2 Digital Display Interfaces 41 ÔÇó Display Port ÔÇó Display Port is a digital display interface. It is the first display interface that uses packetized data transmission, like the Internet or Ethernet ÔÇó Display Port can achieve a higher resolution with fewer pins than the previous technologies. ÔÇó The use of data packets also allows Display Port to be extensible, i.e., new features can be added over time without significant changes to the physical interface itself. ÔÇó Display Port can be used to transmit audio and video simultaneously, or either of them. ÔÇó Compared with HDMI, Display Port has slightly more bandwidth, which also accommodates multiple streams of audio and video to separate devices.
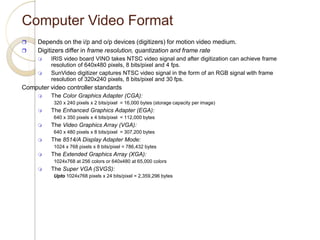
- 42. Computer Video Format  Depends on the i/p and o/p devices (digitizers) for motion video medium.  Digitizers differ in frame resolution, quantization and frame rate  IRIS video board VINO takes NTSC video signal and after digitization can achieve frame resolution of 640x480 pixels, 8 bits/pixel and 4 fps.  SunVideo digitizer captures NTSC video signal in the form of an RGB signal with frame resolution of 320x240 pixels, 8 bits/pixel and 30 fps. Computer video controller standards  The Color Graphics Adapter (CGA): 320 x 240 pixels x 2 bits/pixel = 16,000 bytes (storage capacity per image)  The Enhanced Graphics Adapter (EGA): 640 x 350 pixels x 4 bits/pixel = 112,000 bytes  The Video Graphics Array (VGA): 640 x 480 pixels x 8 bits/pixel = 307,200 bytes  The 8514/A Display Adapter Mode: 1024 x 768 pixels x 8 bits/pixel = 786,432 bytes  The Extended Graphics Array (XGA): 1024x768 at 256 colors or 640x480 at 65,000 colors  The Super VGA (SVGS): Upto 1024x768 pixels x 24 bits/pixel = 2,359,296 bytes
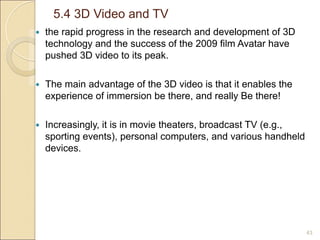
- 43. 5.4 3D Video and TV 43 ÔÇó the rapid progress in the research and development of 3D technology and the success of the 2009 film Avatar have pushed 3D video to its peak. ÔÇó The main advantage of the 3D video is that it enables the experience of immersion be there, and really Be there! ÔÇó Increasingly, it is in movie theaters, broadcast TV (e.g., sporting events), personal computers, and various handheld devices.
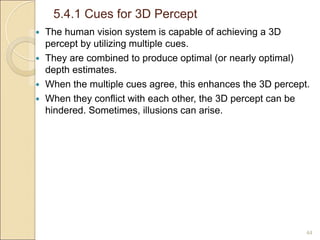
- 44. 5.4.1 Cues for 3D Percept 44 ÔÇó The human vision system is capable of achieving a 3D percept by utilizing multiple cues. ÔÇó They are combined to produce optimal (or nearly optimal) depth estimates. ÔÇó When the multiple cues agree, this enhances the 3D percept. ÔÇó When they conflict with each other, the 3D percept can be hindered. Sometimes, illusions can arise.
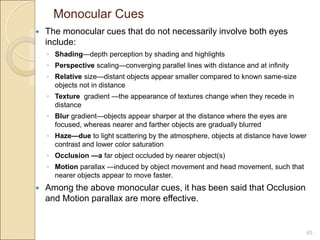
- 45. Monocular Cues 45  The monocular cues that do not necessarily involve both eyes include: ◦ Shading—depth perception by shading and highlights ◦ Perspective scaling—converging parallel lines with distance and at infinity ◦ Relative size—distant objects appear smaller compared to known same-size objects not in distance ◦ Texture gradient —the appearance of textures change when they recede in distance ◦ Blur gradient—objects appear sharper at the distance where the eyes are focused, whereas nearer and farther objects are gradually blurred ◦ Haze—due to light scattering by the atmosphere, objects at distance have lower contrast and lower color saturation ◦ Occlusion —a far object occluded by nearer object(s) ◦ Motion parallax —induced by object movement and head movement, such that nearer objects appear to move faster.  Among the above monocular cues, it has been said that Occlusion and Motion parallax are more effective.
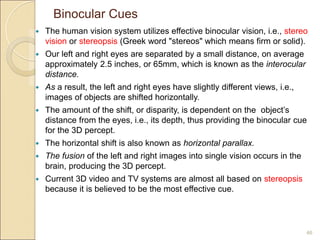
- 46. Binocular Cues 46  The human vision system utilizes effective binocular vision, i.e., stereo vision or stereopsis (Greek word "stereos" which means firm or solid).  Our left and right eyes are separated by a small distance, on average approximately 2.5 inches, or 65mm, which is known as the interocular distance.  As a result, the left and right eyes have slightly different views, i.e., images of objects are shifted horizontally.  The amount of the shift, or disparity, is dependent on the object’s distance from the eyes, i.e., its depth, thus providing the binocular cue for the 3D percept.  The horizontal shift is also known as horizontal parallax.  The fusion of the left and right images into single vision occurs in the brain, producing the 3D percept.  Current 3D video and TV systems are almost all based on stereopsis because it is believed to be the most effective cue.
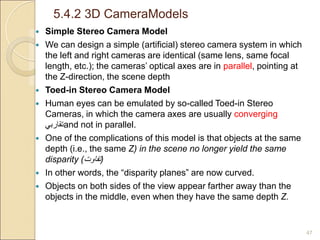
- 47. 5.4.2 3D CameraModels 47  Simple Stereo Camera Model  We can design a simple (artificial) stereo camera system in which the left and right cameras are identical (same lens, same focal length, etc.); the cameras’ optical axes are in parallel, pointing at the Z-direction, the scene depth  Toed-in Stereo Camera Model  Human eyes can be emulated by so-called Toed-in Stereo Cameras, in which the camera axes are usually converging ‫تقاربي‬and not in parallel.  One of the complications of this model is that objects at the same depth (i.e., the same Z) in the scene no longer yield the same disparity (‫تفاوت‬)  In other words, the “disparity planes” are now curved.  Objects on both sides of the view appear farther away than the objects in the middle, even when they have the same depth Z.
- 48. 5.4.3 3DMovie and TV Based on Stereo Vision 48 ÔÇó 3D Movie Using Colored Glasses ÔÇó 3D Movies Using Circularly Polarized Glasses ÔÇó 3D TV with Shutter Glasses
- 49. End of Chapter 5 49