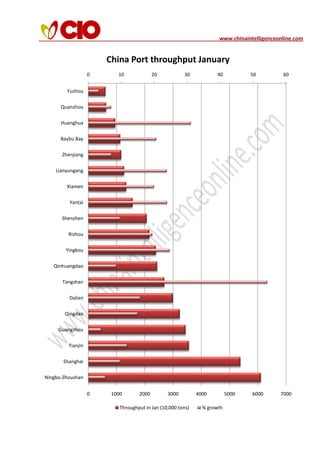
The document is a bar graph showing Chinese port throughput levels in January for various ports. Shanghai had the highest throughput in January at over 6,000 ten-thousand tons, followed by Ningbo-Zhoushan at around 5,000 ten-thousand tons. Throughput levels varied across ports, with some ports experiencing growth compared to the previous year while others saw a decline or stagnant volumes.
1 of 1
Download to read offline
More Related Content
China Port Throughput Jan
1. www.chinaintelligenceonline.com
China Port throughput January
0 10 20 30 40 50 60
Fuzhou
Quanzhou
Huanghua
Baybu Bay
Zhenjiang
Lianyungang
Xiamen
Yantai
Shenzhen
Rizhou
Yingkou
Qinhuangdao
Tangshan
Dalian
Qingdao
Guangzhou
Tianjin
Shanghai
Ningbo-Zhoushan
0 1000 2000 3000 4000 5000 6000 7000
Throughput in Jan (10,000 tons) % growth