
Chi-Square Presentation - Nikki.ppt
- 1. Tutorial: Chi-Square Distribution Presented by: Nikki Natividad Course: BIOL 5081 - Biostatistics
- 2. Purpose ï To measure discontinuous categorical/binned data in which a number of subjects fall into categories ï We want to compare our observed data to what we expect to see. Due to chance? Due to association? ï When can we use the Chi-Square Test? âĶ Testing outcome of Mendelian Crosses, Testing Independence â Is one factor associated with another?, Testing a population for expected proportions
- 3. Assumptions: ï 1 or more categories ï Independent observations ï A sample size of at least 10 ï Random sampling ï All observations must be used ï For the test to be accurate, the expected frequency should be at least 5
- 4. Conducting Chi-Square Analysis 1) Make a hypothesis based on your basic biological question 2) Determine the expected frequencies 3) Create a table with observed frequencies, expected frequencies, and chi-square values using the formula: (O-E)2 E 4) Find the degrees of freedom: (c-1)(r-1) 5) Find the chi-square statistic in the Chi-Square Distribution table 6) If chi-square statistic > your calculated chi-square value, you do not reject your null hypothesis and
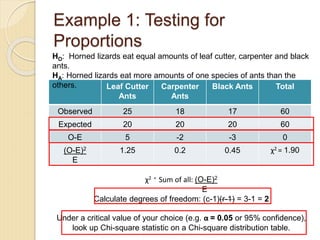
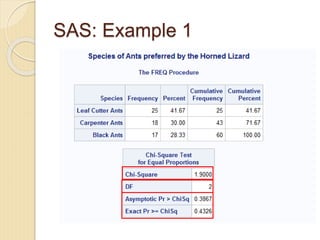
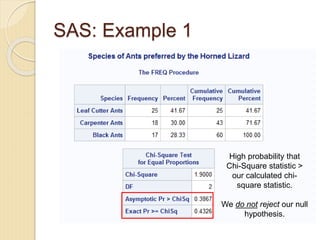
- 5. Example 1: Testing for Proportions Leaf Cutter Ants Carpenter Ants Black Ants Total Observed 25 18 17 60 Expected 20 20 20 60 O-E 5 -2 -3 0 (O-E)2 E 1.25 0.2 0.45 Ï2 = 1.90 HO: Horned lizards eat equal amounts of leaf cutter, carpenter and black ants. HA: Horned lizards eat more amounts of one species of ants than the others. Ï2 = Sum of all: (O-E)2 E Calculate degrees of freedom: (c-1)(r-1) = 3-1 = 2 Under a critical value of your choice (e.g. Îą = 0.05 or 95% confidence), look up Chi-square statistic on a Chi-square distribution table.
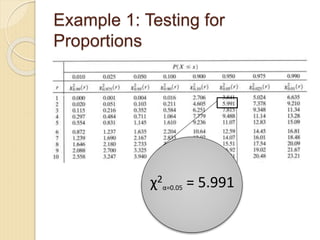
- 6. Example 1: Testing for Proportions Ï2 Îą=0.05 = 5.991
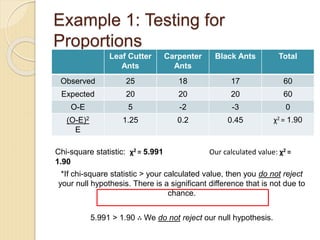
- 7. Example 1: Testing for Proportions Chi-square statistic: Ï2 = 5.991 Our calculated value: Ï2 = 1.90 *If chi-square statistic > your calculated value, then you do not reject your null hypothesis. There is a significant difference that is not due to chance. 5.991 > 1.90 âī We do not reject our null hypothesis. Leaf Cutter Ants Carpenter Ants Black Ants Total Observed 25 18 17 60 Expected 20 20 20 60 O-E 5 -2 -3 0 (O-E)2 E 1.25 0.2 0.45 Ï2 = 1.90
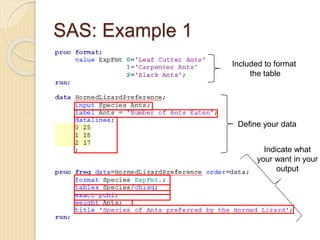
- 8. SAS: Example 1 Included to format the table Define your data Indicate what your want in your output
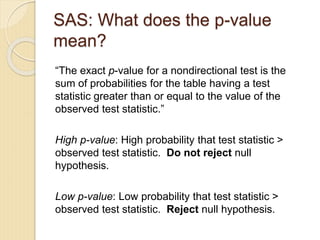
- 10. SAS: What does the p-value mean? âThe exact p-value for a nondirectional test is the sum of probabilities for the table having a test statistic greater than or equal to the value of the observed test statistic.â High p-value: High probability that test statistic > observed test statistic. Do not reject null hypothesis. Low p-value: Low probability that test statistic > observed test statistic. Reject null hypothesis.
- 11. SAS: Example 1 High probability that Chi-Square statistic > our calculated chi- square statistic. We do not reject our null hypothesis.
- 12. SAS: Example 1
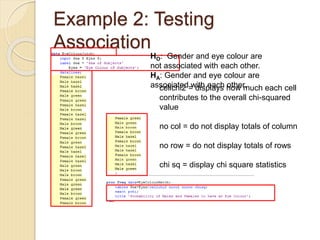
- 13. Example 2: Testing Association c cellchi2 = displays how much each cell contributes to the overall chi-squared value no col = do not display totals of column no row = do not display totals of rows chi sq = display chi square statistics HO: Gender and eye colour are not associated with each other. HA: Gender and eye colour are associated with each other.
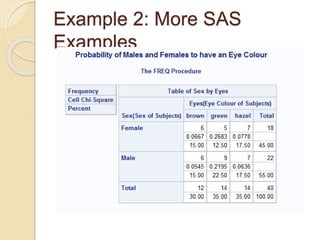
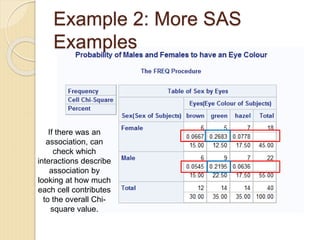
- 14. Example 2: More SAS Examples
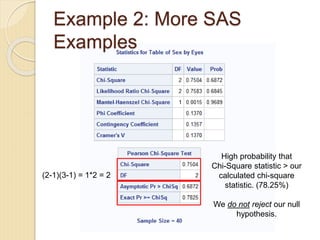
- 15. Example 2: More SAS Examples (2-1)(3-1) = 1*2 = 2 High probability that Chi-Square statistic > our calculated chi-square statistic. (78.25%) We do not reject our null hypothesis.
- 16. Example 2: More SAS Examples If there was an association, can check which interactions describe association by looking at how much each cell contributes to the overall Chi- square value.
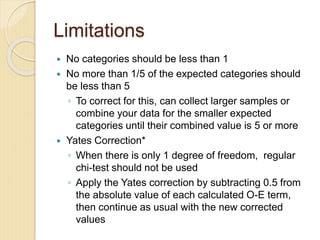
- 17. Limitations ï No categories should be less than 1 ï No more than 1/5 of the expected categories should be less than 5 âĶ To correct for this, can collect larger samples or combine your data for the smaller expected categories until their combined value is 5 or more ï Yates Correction* âĶ When there is only 1 degree of freedom, regular chi-test should not be used âĶ Apply the Yates correction by subtracting 0.5 from the absolute value of each calculated O-E term, then continue as usual with the new corrected values
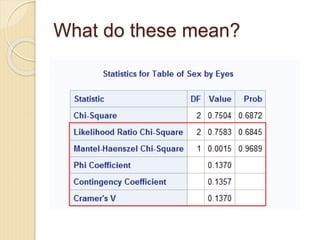
- 18. What do these mean?
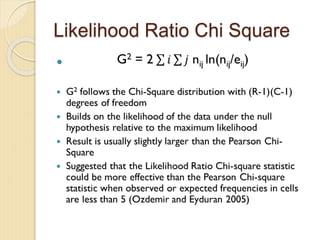
- 19. Likelihood Ratio Chi Square ï
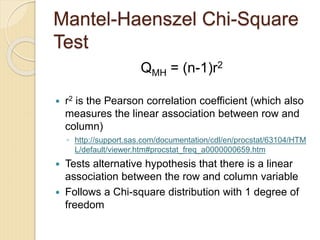
- 21. Mantel-Haenszel Chi-Square Test QMH = (n-1)r2 ï r2 is the Pearson correlation coefficient (which also measures the linear association between row and column) âĶ http://support.sas.com/documentation/cdl/en/procstat/63104/HTM L/default/viewer.htm#procstat_freq_a0000000659.htm ï Tests alternative hypothesis that there is a linear association between the row and column variable ï Follows a Chi-square distribution with 1 degree of freedom
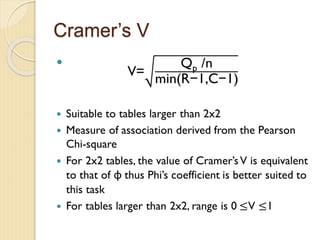
- 24. Cramerâs V ï
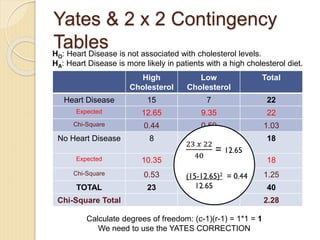
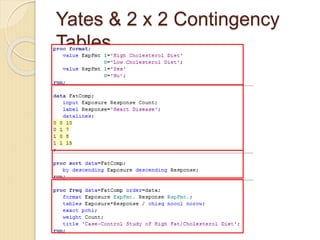
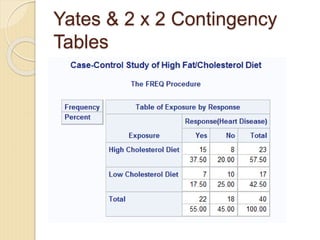
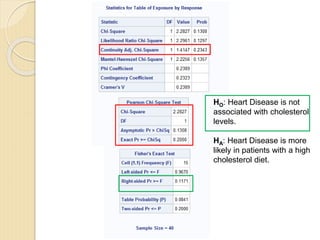
- 25. Yates & 2 x 2 Contingency Tables HO: Heart Disease is not associated with cholesterol levels. HA: Heart Disease is more likely in patients with a high cholesterol diet. Calculate degrees of freedom: (c-1)(r-1) = 1*1 = 1 We need to use the YATES CORRECTION High Cholesterol Low Cholesterol Total Heart Disease 15 7 22 Expected 12.65 9.35 22 Chi-Square 0.44 0.59 1.03 No Heart Disease 8 10 18 Expected 10.35 7.65 18 Chi-Square 0.53 0.72 1.25 TOTAL 23 17 40 Chi-Square Total 2.28
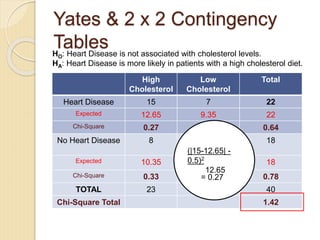
- 26. Yates & 2 x 2 Contingency Tables HO: Heart Disease is not associated with cholesterol levels. HA: Heart Disease is more likely in patients with a high cholesterol diet. High Cholesterol Low Cholesterol Total Heart Disease 15 7 22 Expected 12.65 9.35 22 Chi-Square 0.27 0.37 0.64 No Heart Disease 8 10 18 Expected 10.35 7.65 18 Chi-Square 0.33 0.45 0.78 TOTAL 23 17 40 Chi-Square Total 1.42 (|15-12.65| - 0.5)2 12.65 = 0.27
- 27. Example 1: Testing for Proportions Ï2 Îą=0.05 = 3.841
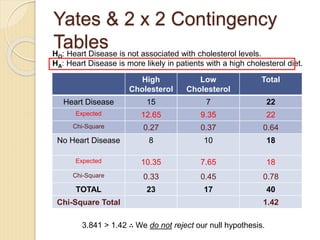
- 28. Yates & 2 x 2 Contingency Tables HO: Heart Disease is not associated with cholesterol levels. HA: Heart Disease is more likely in patients with a high cholesterol diet. 3.841 > 1.42 âī We do not reject our null hypothesis. High Cholesterol Low Cholesterol Total Heart Disease 15 7 22 Expected 12.65 9.35 22 Chi-Square 0.27 0.37 0.64 No Heart Disease 8 10 18 Expected 10.35 7.65 18 Chi-Square 0.33 0.45 0.78 TOTAL 23 17 40 Chi-Square Total 1.42
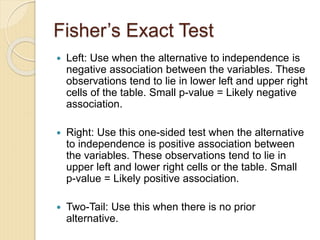
- 29. Fisherâs Exact Test ï Left: Use when the alternative to independence is negative association between the variables. These observations tend to lie in lower left and upper right cells of the table. Small p-value = Likely negative association. ï Right: Use this one-sided test when the alternative to independence is positive association between the variables. These observations tend to lie in upper left and lower right cells or the table. Small p-value = Likely positive association. ï Two-Tail: Use this when there is no prior alternative.
- 30. Yates & 2 x 2 Contingency Tables
- 31. Yates & 2 x 2 Contingency Tables
- 32. HO: Heart Disease is not associated with cholesterol levels. HA: Heart Disease is more likely in patients with a high cholesterol diet.
- 33. Conclusion ï The Chi-square test is important in testing the association between variables and/or checking if oneâs expected proportions meet the reality of oneâs experiment ï There are multiple chi-square tests, each catered to a specific sample size, degrees of freedom, and number of categories ï We can use SAS to conduct Chi-square tests on our data by utilizing the command proc freq
- 34. References Chi-Square Test Descriptions: http://www.enviroliteracy.org/pdf/materials/1210.pdf http://129.123.92.202/biol1020/Statistics/Appendix %206%20%20The%20Chi-Square%20TEst.pdf Ozdemir T and Eyduran E. 2005. Comparison of chi- square and likelihood ratio chi-square tests: power of test. Journal of Applied Sciences Research. 1(2):242-244. SAS Support website: http://www.sas.com/index.html âFREQ procedureâ YouTube Chi-square SAS Tutorial (user: mbate001): http://www.youtube.com/watch?v=ACbQ8FJTq7k