Cluster Analysis
Download as pptx, pdf1 like372 views

The document explores sales data across different store clusters, identifying fresh foods as the highest sales category and health and beauty as the lowest. Using the k-means clustering technique, four initial clusters were formed, with Cluster 3 identified as an outlier due to significantly higher average sales. Recommendations include leveraging outdoor spaces for selling fresh food items based on unique store characteristics and performance.
1 of 11
Download to read offline
Ad
Recommended
Boots Hair Care Case Study
Boots Hair Care Case StudyAnchit Ahuja
?
The document discusses a sales promotion strategy for Boots' professional hair-care products aimed at increasing sales volume while retaining brand equity. It outlines consumer demographics, competition, and three potential promotional strategies, with the '3-for-2' approach yielding the highest profit and consumer reach. Sales manager Dave Robinson must choose the most effective strategy by December 2004.ashraf letest cv.
ashraf letest cv.Ashraf Jahan
?
This resume summarizes Ashraf Jahan's qualifications and experience in quality assurance and quality control. He has over 12 years of experience in QA/QC for petrochemical plants and construction projects. He is seeking a long term career in an organization that values commitment and provides challenges to utilize his skills. His expertise includes managing QA/QC procedures and departments, performing audits, and ensuring projects meet quality standards. He has worked on numerous projects in Saudi Arabia for companies like Saudi Aramco and SABIC.R&R 2015 Regnskabsafl?ggelse i interessentskaber
R&R 2015 Regnskabsafl?ggelse i interessentskabermettelaursen76
?
Regnskabsafl?ggelse i interessentskaber - med fokus p? s?rlige regnskabsm?ssige forhold.Final case study powerpoint
Final case study powerpointRamachandran N
?
The document presents a case study on predictive modeling for equestrian sports, utilizing linear regression to analyze and predict betting handle values influenced by various factors such as the number of runners, holidays, and race types. It highlights the model's accuracy in predicting handles up to 700,000, while showing limitations in higher values, alongside indicating the ideal values needed to maximize handle. Graphs and statistical data are provided to illustrate the predictions and errors associated with different tracks and conditions.FSA strategic plan 2015-20
FSA strategic plan 2015-20Richard McLean
?
The Food Standards Agency strategic plan for 2015-2020 identifies its mission to protect public health and consumer interests in relation to food. The plan focuses on ensuring food is safe and authentic, gathering science and evidence, empowering consumers, and aligning business incentives with consumer interests. Key activities include using evidence-based policy, effective enforcement, transparency, and engaging stakeholders. The plan aims to leverage the agency's impact through developing capabilities in people, collaboration, and monitoring food system performance.Dove andare a vivere a Sydney?
Dove andare a vivere a Sydney?Cangurizzato
?
Il documento discute i migliori quartieri in cui vivere a Sydney, evidenziando l'importanza di non allontanarsi troppo dal centro. Consiglia i suburb ben collegati come Pyrmont e Surry Hills, e menziona Bondi Junction e Bondi Beach come opzioni convenienti e accessibili. Viene sottolineata la preferenza per vivere in aree centrali per una migliore accessibilit¨¤ e intrattenimento.10 §á§â§Ú§é§Ú§ß
10 §á§â§Ú§é§Ú§ß§ł§Ń§á§Ö§Ô§Ú§ß§Ń §°§Ý§î§Ô§Ń
?
This short document promotes the creation of presentations using Haiku Deck on şÝşÝߣShare. It features a stock photo and text prompting the reader to get started making their own Haiku Deck presentation. In just a few words, it pitches the idea of using Haiku Deck on şÝşÝߣShare to easily create engaging presentations.Untitled Presentation
Untitled Presentationaouatef17
?
This short document promotes creating presentations using Haiku Deck, a tool for making slideshows. It encourages the reader to get started making their own Haiku Deck presentation and sharing it on şÝşÝߣShare. In a single sentence, it pitches presentation creation software.DominickˇŻs retail analysis
DominickˇŻs retail analysisEeshan Srivastava
?
The document analyses the demographic makeup and sales patterns of Dominick's grocery stores to recommend targeted positioning strategies for maximizing profits. Using k-means segmentation, four store clusters were identified based on various socioeconomic factors, revealing differences in customer characteristics and sales across these clusters. Key recommendations include targeting the right market segments and incorporating additional types of segmentation to avoid stereotyping.Cluster analysis - Wholesale customers data set
Cluster analysis - Wholesale customers data setDivya Ganjoo, PMP? CSM?
?
This document analyzes customer spending data from wholesale customers to identify spending clusters. It finds strong correlations between certain spending categories. Hierarchical and k-means clustering both identify around 3 main clusters. Cluster 1 consists of high spenders on milk, grocery and detergent products who tend to use the retail channel. Cluster 2 has high fresh and frozen spenders who are more likely to use the hotel/restaurant channel. Cluster 3 contains low overall spenders. Analyzing spending on grocery, detergent and milk captures most of the variability in the data.T20 cluster analysis
T20 cluster analysiskompellark
?
Cluster analysis is an interdependence multivariate method used to classify objects like customers or products into groups. The goal is to maximize similarity within groups and differences between groups. It involves calculating distances between objects on multiple variables to group similar objects together in clusters. Marketers can use cluster analysis for applications like identifying customer segments, examining product brand positioning relative to competitors, and designing test market regions.Database Marketing - Dominick's stores in Chicago distric
Database Marketing - Dominick's stores in Chicago districDemin Wang
?
The analysis evaluates the sales performance of Dominick's grocery stores in the Chicago area through corporate and category-level assessments, using clustering and discriminant analysis to group stores and identify targetable characteristics. Key findings suggest an optimal model of 6 clusters for corporate analysis and a distinct focus on demographic profiles to inform marketing strategies. Recommendations include resource allocation for underperforming segments and targeted strategies for new product launches based on demographic insights.Retail Management- Consumer Buying Behavior and Planogram
Retail Management- Consumer Buying Behavior and PlanogramSumit Chakraborty
?
- The Indian retail market is projected to grow from $716 billion currently to $1.245 trillion by 2018, with organized retail making up 8% of the market. Foreign direct investment of up to 100% is allowed in single-brand retail.
- A study of retail stores in Navi Mumbai found that consumers prioritize price, brand, and quality. Organized retailers provided more convenience but food product quality was rated low, especially in evenings.
- Both organized and unorganized retailers faced issues like long wait times, lack of attention to product quality variations, and not addressing consumer complaints. Changes were recommended like improving product quality and customer service.Clustering
ClusteringShikha Ujjwal Dalmia
?
The document describes a methodology for clustering grocery stores of a retailer in Karnataka and Tamil Nadu based on sales data. Exploratory data analysis was conducted on the sales and store size data, which found that category 1 sales were highest on average. The data was then prepared for clustering by standardizing percentage sales variables, and weighting the average sales per square foot variable through multiple iterations. Preliminary K-means clustering was performed using PROC FASTCLUS to create clusters and identify outliers.Predictive Analytics for Scott Toilet Tissue
Predictive Analytics for Scott Toilet TissueVibhore Agarwal
?
This document contains an agenda and analysis for Vibhore Agarawal on drug and grocery market sectors. It includes:
1) Market overviews showing top brands' market shares over 5 years.
2) Time series analysis of drug and grocery store sales data, including price and sales trends and 10-week sales forecasts.
3) Customer segmentation based on demographics and purchasing patterns to identify target segments.
4) Affinity analysis to identify private label and Scott competitors' strongest customer attributes and recommendations.Retail analytics (SAS programming,big data analytics)
Retail analytics (SAS programming,big data analytics)data-analytics
?
India's organized retail sector, valued at INR 16 trillion, is rapidly growing but faces challenges such as high operational costs, increased competition, and customer loyalty issues. Key insights from the analysis include the impact of unviable retail formats, significant lease costs, and the need for better backend investment. The report emphasizes the importance of adapting retail strategies through analytics to enhance customer satisfaction and operational efficiency while exploring eco-friendly models to reduce costs.Standard display procedure of vishal mega mart
Standard display procedure of vishal mega martnoT yeT wOrKinG!! i M sTilL sTuDInG!!
?
Vishal Megamart is a leading retail chain in India founded in 2001. It offers affordable fashion and grocery items. Its main customers are youth who visit one or more times per week. Key competitors include Big Bazaar and Reliance Fresh. A survey of Vishal customers found that most prefer to buy dress materials and rate Vishal's offerings and display patterns positively. Suggestions were made to improve availability of all sizes and better assist customers to enhance their shopping experience.Customer Profiling
Customer Profilingmanish gupta
?
The document analyzes customer data from a software company using cluster analysis to group customers. It identifies 7 clusters: Loyal, Casual, Somewhat Casuals, Somewhat Loyal, Most Consistent, Mixed, and Price Sensitive. The clusters are profiled based on characteristics like average spending, purchase frequency, and response to discounts. The document recommends strategies for each cluster like offering bulk discounts to Loyal customers who buy large quantities and single purchase discounts to Casual customers.GIRISH FOOD STORE ( CASE PRESENTATION
GIRISH FOOD STORE ( CASE PRESENTATION Jyoti Punj Prakash
?
Girish Food Store is a 50-year old grocery store owned by the third generation of the family that is facing increased competition from modern retail formats as it approaches its Golden Jubilee anniversary. The grocery industry in India provides employment to 5% of the workforce and retail stores contribute Rs. 3000 crore in annual sales, though the industry is experiencing a changing retail landscape with different store formats emerging. The case study analyzes customer data and sales figures to make recommendations around category management, assortment strategies, promotions, and classification of product categories to help Girish Food Store adapt to the evolving market.Retail sales forecasting - predictive data analytics
Retail sales forecasting - predictive data analyticsRistanti Ramadanti
?
The document outlines a project aimed at forecasting sales for 1,115 health and beauty stores in Germany over a 31-month period using various data analytics methods. The team employed a random forest regression model, which achieved the lowest RMSE for predicting 6-week sales, highlighting important insights into factors affecting sales such as store type and promotional strategies. Recommendations include enriching data with additional variables and reevaluating promotional strategies due to identified negative impacts on sales.Uday synopsis
Uday synopsisUday Dakre
?
This document provides an overview of a study on the retail mix of Reliance Fresh outlets in Nagpur City, India. The study aims to analyze the effectiveness of the retail mix in attracting and retaining customers through factors like store location, product assortment, pricing, and promotions. Primary data will be collected through questionnaires from 100 customers and analyzed using charts. The study hypothesizes that Reliance Fresh's retail mix is effective in drawing customers. Limitations include time constraints and reliability of self-reported customer information. Suggestions will be provided based on conclusions from the data analysis.A DETAILED ANALYSIS OF A RETAIL BUSINESS DATASET
A DETAILED ANALYSIS OF A RETAIL BUSINESS DATASETKehinde (Kenny) Ogunjemilusi
?
This report analyzes the retail sales and supermarket business of Mr. Chukwudi across Nigeria, covering 19 years of data with insights on geographic, occupational, age, product type, and gender factors. Kebbi state generated the highest sales revenue, largely driven by medium-sized stores, while male entrepreneurs accounted for the majority of purchases. Recommendations include enhancing product visibility, expanding medium-sized stores, and increasing marketing efforts to attract more diverse customer demographics.Final Project Report - Walmart Sales
Final Project Report - Walmart SalesDeepti Bahel
?
This document summarizes a sales analysis project of Walmart data that was conducted by students at Purdue University. The project aimed to analyze weekly and monthly sales across Walmart's departments and 45 stores. Factors like temperature, fuel prices, unemployment, markdowns, and store size were analyzed to determine their impact on sales using linear regression models. Two interactive Shiny apps were developed to help Walmart category managers visualize the sales data and regression results in an easy-to-use interface. Key findings included the optimal store size range for sales and periods of higher sales linked to holidays, taxes, or markdowns.ˇ°Customer perception towards Reliance martˇ± At Bangalore
ˇ°Customer perception towards Reliance martˇ± At Bangaloreudgamdwd
?
The document presents a study on customer perception towards Reliance Mart, highlighting the Indian retail industry's significance and the company's various offerings. Key findings indicate high customer satisfaction with product quality and store ambience, but reveal concerns about staff knowledge and billing speed. Recommendations include enhancing staff training, improving billing processes, and expanding product variety to better meet customer needs.Store location
Store locationKittu Rajpal
?
The document summarizes information about various retail stores located in different areas of Ahmedabad. It provides details about the store formats, product assortments, customer profiles, operational details, and competitive landscapes of stores ranging from specialty apparel and electronics boutiques to automobile dealerships, pan shops, grocery stores, and marble/tile merchants. Key areas discussed include CBD, Gota, and isolated store locations catering to different customer segments across income levels.Food Shopper Insights: Grocery Shopping Trends in the U.S.
Food Shopper Insights: Grocery Shopping Trends in the U.S.MarketResearch.com
?
The document summarizes key findings from a report about grocery shopping trends in the U.S. It found that most grocery shoppers shop at one store, are loyal to that store, and choose it based on convenience and low prices. Many grocery shoppers plan their shopping trips, make lists, and use coupons. In the store, most shop alone and go straight home after shopping. The report provides insights into grocery shopping behaviors to help grocers and food marketers better understand shoppers.7p's of Retailing Industry
7p's of Retailing IndustryJalpa Patel
?
Reliance Fresh is a retail store chain owned by Reliance Industries. It aims to revolutionize retail in India through its convenience store format located close to residential areas. The stores offer a wide range of products from groceries to personal care items at competitive prices. Reliance Fresh aims to expand its store network across India to tap the growing retail market potential. However, macroeconomic uncertainties and rising costs pose challenges to its growth.Dhara Mehta-Reliance Fresh SIP
Dhara Mehta-Reliance Fresh SIPMdharaP
?
The document presents a study on customer satisfaction with the product range availability at Reliance Fresh stores. It discusses the retail industry overview and history. It also provides an overview of Reliance Fresh, including its history and performance. The study aims to determine if customers are satisfied with the fruits and vegetables available and examines customer perceptions of brands for rice, hair conditioners and blended spices. A survey was conducted with 150 respondents and results showed that most customers were satisfied with the product range overall and found the variety of fruits and vegetables to be good.Residential Zone 4 for industrial village
Residential Zone 4 for industrial villageMdYasinArafat13
?
based on assumption that failure of such a weld is by shear on the
effective area whether the shear transfer is parallel to or
perpendicular to the axis of the line of fillet weld. In fact, the
strength is greater for shear transfer perpendicular to the weld axis;
however, for simplicity the situations are treated the same.More Related Content
Similar to Cluster Analysis (20)
DominickˇŻs retail analysis
DominickˇŻs retail analysisEeshan Srivastava
?
The document analyses the demographic makeup and sales patterns of Dominick's grocery stores to recommend targeted positioning strategies for maximizing profits. Using k-means segmentation, four store clusters were identified based on various socioeconomic factors, revealing differences in customer characteristics and sales across these clusters. Key recommendations include targeting the right market segments and incorporating additional types of segmentation to avoid stereotyping.Cluster analysis - Wholesale customers data set
Cluster analysis - Wholesale customers data setDivya Ganjoo, PMP? CSM?
?
This document analyzes customer spending data from wholesale customers to identify spending clusters. It finds strong correlations between certain spending categories. Hierarchical and k-means clustering both identify around 3 main clusters. Cluster 1 consists of high spenders on milk, grocery and detergent products who tend to use the retail channel. Cluster 2 has high fresh and frozen spenders who are more likely to use the hotel/restaurant channel. Cluster 3 contains low overall spenders. Analyzing spending on grocery, detergent and milk captures most of the variability in the data.T20 cluster analysis
T20 cluster analysiskompellark
?
Cluster analysis is an interdependence multivariate method used to classify objects like customers or products into groups. The goal is to maximize similarity within groups and differences between groups. It involves calculating distances between objects on multiple variables to group similar objects together in clusters. Marketers can use cluster analysis for applications like identifying customer segments, examining product brand positioning relative to competitors, and designing test market regions.Database Marketing - Dominick's stores in Chicago distric
Database Marketing - Dominick's stores in Chicago districDemin Wang
?
The analysis evaluates the sales performance of Dominick's grocery stores in the Chicago area through corporate and category-level assessments, using clustering and discriminant analysis to group stores and identify targetable characteristics. Key findings suggest an optimal model of 6 clusters for corporate analysis and a distinct focus on demographic profiles to inform marketing strategies. Recommendations include resource allocation for underperforming segments and targeted strategies for new product launches based on demographic insights.Retail Management- Consumer Buying Behavior and Planogram
Retail Management- Consumer Buying Behavior and PlanogramSumit Chakraborty
?
- The Indian retail market is projected to grow from $716 billion currently to $1.245 trillion by 2018, with organized retail making up 8% of the market. Foreign direct investment of up to 100% is allowed in single-brand retail.
- A study of retail stores in Navi Mumbai found that consumers prioritize price, brand, and quality. Organized retailers provided more convenience but food product quality was rated low, especially in evenings.
- Both organized and unorganized retailers faced issues like long wait times, lack of attention to product quality variations, and not addressing consumer complaints. Changes were recommended like improving product quality and customer service.Clustering
ClusteringShikha Ujjwal Dalmia
?
The document describes a methodology for clustering grocery stores of a retailer in Karnataka and Tamil Nadu based on sales data. Exploratory data analysis was conducted on the sales and store size data, which found that category 1 sales were highest on average. The data was then prepared for clustering by standardizing percentage sales variables, and weighting the average sales per square foot variable through multiple iterations. Preliminary K-means clustering was performed using PROC FASTCLUS to create clusters and identify outliers.Predictive Analytics for Scott Toilet Tissue
Predictive Analytics for Scott Toilet TissueVibhore Agarwal
?
This document contains an agenda and analysis for Vibhore Agarawal on drug and grocery market sectors. It includes:
1) Market overviews showing top brands' market shares over 5 years.
2) Time series analysis of drug and grocery store sales data, including price and sales trends and 10-week sales forecasts.
3) Customer segmentation based on demographics and purchasing patterns to identify target segments.
4) Affinity analysis to identify private label and Scott competitors' strongest customer attributes and recommendations.Retail analytics (SAS programming,big data analytics)
Retail analytics (SAS programming,big data analytics)data-analytics
?
India's organized retail sector, valued at INR 16 trillion, is rapidly growing but faces challenges such as high operational costs, increased competition, and customer loyalty issues. Key insights from the analysis include the impact of unviable retail formats, significant lease costs, and the need for better backend investment. The report emphasizes the importance of adapting retail strategies through analytics to enhance customer satisfaction and operational efficiency while exploring eco-friendly models to reduce costs.Standard display procedure of vishal mega mart
Standard display procedure of vishal mega martnoT yeT wOrKinG!! i M sTilL sTuDInG!!
?
Vishal Megamart is a leading retail chain in India founded in 2001. It offers affordable fashion and grocery items. Its main customers are youth who visit one or more times per week. Key competitors include Big Bazaar and Reliance Fresh. A survey of Vishal customers found that most prefer to buy dress materials and rate Vishal's offerings and display patterns positively. Suggestions were made to improve availability of all sizes and better assist customers to enhance their shopping experience.Customer Profiling
Customer Profilingmanish gupta
?
The document analyzes customer data from a software company using cluster analysis to group customers. It identifies 7 clusters: Loyal, Casual, Somewhat Casuals, Somewhat Loyal, Most Consistent, Mixed, and Price Sensitive. The clusters are profiled based on characteristics like average spending, purchase frequency, and response to discounts. The document recommends strategies for each cluster like offering bulk discounts to Loyal customers who buy large quantities and single purchase discounts to Casual customers.GIRISH FOOD STORE ( CASE PRESENTATION
GIRISH FOOD STORE ( CASE PRESENTATION Jyoti Punj Prakash
?
Girish Food Store is a 50-year old grocery store owned by the third generation of the family that is facing increased competition from modern retail formats as it approaches its Golden Jubilee anniversary. The grocery industry in India provides employment to 5% of the workforce and retail stores contribute Rs. 3000 crore in annual sales, though the industry is experiencing a changing retail landscape with different store formats emerging. The case study analyzes customer data and sales figures to make recommendations around category management, assortment strategies, promotions, and classification of product categories to help Girish Food Store adapt to the evolving market.Retail sales forecasting - predictive data analytics
Retail sales forecasting - predictive data analyticsRistanti Ramadanti
?
The document outlines a project aimed at forecasting sales for 1,115 health and beauty stores in Germany over a 31-month period using various data analytics methods. The team employed a random forest regression model, which achieved the lowest RMSE for predicting 6-week sales, highlighting important insights into factors affecting sales such as store type and promotional strategies. Recommendations include enriching data with additional variables and reevaluating promotional strategies due to identified negative impacts on sales.Uday synopsis
Uday synopsisUday Dakre
?
This document provides an overview of a study on the retail mix of Reliance Fresh outlets in Nagpur City, India. The study aims to analyze the effectiveness of the retail mix in attracting and retaining customers through factors like store location, product assortment, pricing, and promotions. Primary data will be collected through questionnaires from 100 customers and analyzed using charts. The study hypothesizes that Reliance Fresh's retail mix is effective in drawing customers. Limitations include time constraints and reliability of self-reported customer information. Suggestions will be provided based on conclusions from the data analysis.A DETAILED ANALYSIS OF A RETAIL BUSINESS DATASET
A DETAILED ANALYSIS OF A RETAIL BUSINESS DATASETKehinde (Kenny) Ogunjemilusi
?
This report analyzes the retail sales and supermarket business of Mr. Chukwudi across Nigeria, covering 19 years of data with insights on geographic, occupational, age, product type, and gender factors. Kebbi state generated the highest sales revenue, largely driven by medium-sized stores, while male entrepreneurs accounted for the majority of purchases. Recommendations include enhancing product visibility, expanding medium-sized stores, and increasing marketing efforts to attract more diverse customer demographics.Final Project Report - Walmart Sales
Final Project Report - Walmart SalesDeepti Bahel
?
This document summarizes a sales analysis project of Walmart data that was conducted by students at Purdue University. The project aimed to analyze weekly and monthly sales across Walmart's departments and 45 stores. Factors like temperature, fuel prices, unemployment, markdowns, and store size were analyzed to determine their impact on sales using linear regression models. Two interactive Shiny apps were developed to help Walmart category managers visualize the sales data and regression results in an easy-to-use interface. Key findings included the optimal store size range for sales and periods of higher sales linked to holidays, taxes, or markdowns.ˇ°Customer perception towards Reliance martˇ± At Bangalore
ˇ°Customer perception towards Reliance martˇ± At Bangaloreudgamdwd
?
The document presents a study on customer perception towards Reliance Mart, highlighting the Indian retail industry's significance and the company's various offerings. Key findings indicate high customer satisfaction with product quality and store ambience, but reveal concerns about staff knowledge and billing speed. Recommendations include enhancing staff training, improving billing processes, and expanding product variety to better meet customer needs.Store location
Store locationKittu Rajpal
?
The document summarizes information about various retail stores located in different areas of Ahmedabad. It provides details about the store formats, product assortments, customer profiles, operational details, and competitive landscapes of stores ranging from specialty apparel and electronics boutiques to automobile dealerships, pan shops, grocery stores, and marble/tile merchants. Key areas discussed include CBD, Gota, and isolated store locations catering to different customer segments across income levels.Food Shopper Insights: Grocery Shopping Trends in the U.S.
Food Shopper Insights: Grocery Shopping Trends in the U.S.MarketResearch.com
?
The document summarizes key findings from a report about grocery shopping trends in the U.S. It found that most grocery shoppers shop at one store, are loyal to that store, and choose it based on convenience and low prices. Many grocery shoppers plan their shopping trips, make lists, and use coupons. In the store, most shop alone and go straight home after shopping. The report provides insights into grocery shopping behaviors to help grocers and food marketers better understand shoppers.7p's of Retailing Industry
7p's of Retailing IndustryJalpa Patel
?
Reliance Fresh is a retail store chain owned by Reliance Industries. It aims to revolutionize retail in India through its convenience store format located close to residential areas. The stores offer a wide range of products from groceries to personal care items at competitive prices. Reliance Fresh aims to expand its store network across India to tap the growing retail market potential. However, macroeconomic uncertainties and rising costs pose challenges to its growth.Dhara Mehta-Reliance Fresh SIP
Dhara Mehta-Reliance Fresh SIPMdharaP
?
The document presents a study on customer satisfaction with the product range availability at Reliance Fresh stores. It discusses the retail industry overview and history. It also provides an overview of Reliance Fresh, including its history and performance. The study aims to determine if customers are satisfied with the fruits and vegetables available and examines customer perceptions of brands for rice, hair conditioners and blended spices. A survey was conducted with 150 respondents and results showed that most customers were satisfied with the product range overall and found the variety of fruits and vegetables to be good.Recently uploaded (20)
Residential Zone 4 for industrial village
Residential Zone 4 for industrial villageMdYasinArafat13
?
based on assumption that failure of such a weld is by shear on the
effective area whether the shear transfer is parallel to or
perpendicular to the axis of the line of fillet weld. In fact, the
strength is greater for shear transfer perpendicular to the weld axis;
however, for simplicity the situations are treated the same.×îĐ°ćĂŔąúĽÓŔű¸ŁÄáŃÇ´óѧľÉ˝đÉ˝·¨Ń§Ôş±Ďҵ֤Ł¨±«°äł˘˛ą·Éł§ąó±Ďҵ֤Ę飩¶¨ÖĆ
×îĐ°ćĂŔąúĽÓŔű¸ŁÄáŃÇ´óѧľÉ˝đÉ˝·¨Ń§Ôş±Ďҵ֤Ł¨±«°äł˘˛ą·Éł§ąó±Ďҵ֤Ę飩¶¨ÖĆtaqyea
?
Ň»±ČŇ»»ąÔĽÓŔű¸ŁÄáŃÇ´óѧľÉ˝đÉ˝·¨Ń§Ôş±Ďҵ֤/UCLawSF±Ďҵ֤Ęé2025԰桾qޱ1954292140ˇżÎŇĂÇרҵ°ěŔí°ÄÖŢ´óѧ±Ďҵ֤łÉĽ¨µĄŁ¬ĂŔąú´óѧ±Ďҵ֤łÉĽ¨µĄ,Ó˘ąú´óѧ±Ďҵ֤łÉĽ¨µĄŁ¬ĽÓÄĂ´ó´óѧ±Ďҵ֤łÉĽ¨µĄŁ¬ĐÂĽÓĆ´óѧ±Ďҵ֤łÉĽ¨µĄŁ¬ĐÂÎ÷ŔĽ´óѧ±Ďҵ֤łÉĽ¨µĄŁ¬ş«ąú´óѧ±Ďҵ֤łÉĽ¨µĄŁ¬ČŐ±ľ´óѧ±Ďҵ֤łÉĽ¨µĄˇŁ
ˇľ¸´żĚŇ»Ě׼ÓŔű¸ŁÄáŃÇ´óѧľÉ˝đÉ˝·¨Ń§Ôş±Ďҵ֤łÉĽ¨µĄĐĹ·âµČ˛ÄÁĎ×îÇżąĄÂÔ,Buy University of California College of the Law, San Francisco Transcriptsˇż
ąşÂňČŐş«łÉĽ¨µĄˇ˘Ó˘ąú´óѧłÉĽ¨µĄˇ˘ĂŔąú´óѧłÉĽ¨µĄˇ˘°ÄÖŢ´óѧłÉĽ¨µĄˇ˘ĽÓÄĂ´ó´óѧłÉĽ¨µĄŁ¨q΢1954292140Ł©ĐÂĽÓĆ´óѧłÉĽ¨µĄˇ˘ĐÂÎ÷ŔĽ´óѧłÉĽ¨µĄˇ˘°®¶űŔĽłÉĽ¨µĄˇ˘Î÷°ŕŃŔłÉĽ¨µĄˇ˘µÂąúłÉĽ¨µĄˇŁłÉĽ¨µĄµÄŇâŇĺÖ÷ŇŞĚĺĎÖÔÚÖ¤Ă÷ѧϰÄÜÁ¦ˇ˘ĆŔąŔѧĘő±łľ°ˇ˘ŐąĘľ×ŰşĎËŘÖʡ˘Ěá¸ß¼ȡÂĘŁ¬ŇÔĽ°ĘÇ×÷ÎŞÁôĐĹČĎÖ¤ÉęÇë˛ÄÁϵÄŇ»˛ż·ÖˇŁ
ĽÓŔű¸ŁÄáŃÇ´óѧľÉ˝đÉ˝·¨Ń§ÔşłÉĽ¨µĄÄÜą»ĚĺĎÖÄúµÄµÄѧϰÄÜÁ¦Ł¬°üŔ¨ĽÓŔű¸ŁÄáŃÇ´óѧľÉ˝đÉ˝·¨Ń§ÔşżÎłĚłÉĽ¨ˇ˘×¨ŇµÄÜÁ¦ˇ˘ŃĐľżÄÜÁ¦ˇŁŁ¨q΢1954292140Ł©ľßĚĺŔ´ËµŁ¬łÉĽ¨±¨¸ćµĄÍ¨łŁ°üş¬Ń§ÉúµÄѧϰĽĽÄÜÓëĎ°ąßˇ˘¸÷żĆłÉĽ¨ŇÔĽ°ŔĎʦĆŔÓďµČ˛ż·ÖŁ¬Ňň´ËŁ¬łÉĽ¨µĄ˛»˝öĘÇѧÉúѧĘőÄÜÁ¦µÄÖ¤Ă÷Ł¬Ň˛ĘÇĆŔąŔѧÉúĘÇ·ńĘĘşĎÄł¸ö˝ĚÓýĎîÄżµÄÖŘŇŞŇŔľÝŁˇ
ÎŇĂÇłĐŵ˛ÉÓõÄĘÇѧУ԰ćÖ˝ŐĹŁ¨Ô°ćÖ˝Öʡ˘µ×É«ˇ˘ÎĆ·Ł©ÎŇĂÇą¤ł§ÓµÓĐČ«Ě×˝řżÚÔ×°É豸Ł¬ĚŘĘ⹤ŇŐ¶ĽĘDzÉÓò»Í¬»úĆ÷ÖĆ×÷Ł¬·ÂŐć¶Č»ů±ľżÉŇÔ´ďµ˝100%Ł¬ËůÓĐłÉĆ·ŇÔĽ°ą¤ŇŐЧąű¶ĽżÉĚáÇ°¸řżÍ»§ŐąĘľŁ¬˛»ÂúŇâżÉŇÔ¸ůľÝżÍ»§ŇŞÇó˝řĐе÷ŐűŁ¬Ö±µ˝ÂúŇâÎŞÖąŁˇ
ˇľÖ÷ÓŞĎîÄżˇż
Ň»ˇ˘ą¤×÷δȷ¶¨Ł¬»ŘąúĐčĎȸř¸¸Ä¸ˇ˘Ç×ĆÝĹóÓŃż´ĎÂÎÄĆľµÄÇéżöŁ¬°ěŔí±Ďҵ֤|°ěŔíÎÄĆľ: Âň´óѧ±Ďҵ֤|Âň´óѧÎÄĆľˇľqޱ1954292140ˇżĽÓŔű¸ŁÄáŃÇ´óѧľÉ˝đÉ˝·¨Ń§ÔşŃ§Î»Ö¤Ă÷ĘéČçşÎ°ěŔíÉęÇ룿
¶ţˇ˘»Řąú˝řË˝Ćóˇ˘ÍâĆóˇ˘×ÔĽş×öÉúŇâµÄÇéżöŁ¬ŐâĐ©µĄÎ»ĘDz»˛éŃŻ±Ďҵ֤ŐćαµÄŁ¬¶řÇŇąúÄÚĂ»ÓĐÇţµŔČĄ˛éŃŻąúÍâÎÄĆľµÄŐćĽŮŁ¬Ň˛˛»ĐčŇŞĚáą©Őćʵ˝ĚÓý˛żČĎÖ¤ˇŁĽřÓÚ´ËŁ¬°ěŔíĂŔąúłÉĽ¨µĄĽÓŔű¸ŁÄáŃÇ´óѧľÉ˝đÉ˝·¨Ń§Ôş±Ďҵ֤ˇľqޱ1954292140ˇżąúÍâ´óѧ±Ďҵ֤, ÎÄĆľ°ěŔí, ąúÍâÎÄĆľ°ěŔí, ÁôĐĹÍřČĎÖ¤
Čý.˛ÄÁĎ×ÉŃŻ°ěŔíˇ˘ČĎÖ¤×ÉŃŻ°ěŔíÇëĽÓѧŔúąËÎʡľÎ˘ĐĹ:1954292140ˇżĽÓŔű¸ŁÄáŃÇ´óѧľÉ˝đÉ˝·¨Ń§Ôş±Ďҵ֤ąşÂňÖ¸´óѧÎÄĆľąşÂňŁ¬±Ďҵ֤°ěŔíşÍÎÄĆľ°ěŔíˇŁŃ§ÔşÎÄĆľ¶¨ÖĆŁ¬Ń§ĐŁÔ°ćÎÄĆľ˛ą°ěŁ¬É¨ĂčĽţÎÄĆľ¶¨×öŁ¬100%ÎÄĆľ¸´żĚˇŁMicrosoft Power BI - Advanced Certificate for Business Intelligence using Pow...
Microsoft Power BI - Advanced Certificate for Business Intelligence using Pow...Prasenjit Debnath
?
Completed Power BI - Advanced Masterclass from Skill Nation×îĐ°ćĂŔąúÔĽş˛»ôĆŐ˝đËą´óѧ±Ďҵ֤Ł¨´ł±á±«±Ďҵ֤Ę飩԰涨ÖĆ
×îĐ°ćĂŔąúÔĽş˛»ôĆŐ˝đËą´óѧ±Ďҵ֤Ł¨´ł±á±«±Ďҵ֤Ę飩԰涨ÖĆTaqyea
?
2025Ô°ćÔĽş˛»ôĆŐ˝đËą´óѧ±Ďҵ֤Ęépdfµç×Ӱ桾qޱ1954292140ˇżĂŔąú±Ďҵ֤°ěŔíJHUÔĽş˛»ôĆŐ˝đËą´óѧ±Ďҵ֤Ęé¶ŕÉŮÇ®Łżˇľqޱ1954292140ˇżşŁÍâ¸÷´óѧDiploma°ć±ľŁ¬ŇňÎŞŇßÇéѧУÍƳٷ˘·ĹÖ¤Ę顢֤ĘéÔĽţ¶ŞĘ§˛ą°ěˇ˘Ă»ÓĐŐýłŁ±ĎҵδÄÜČĎ֤ѧŔúĂćÁŮľÍҵĚáą©˝âľö°ě·¨ˇŁµ±ÔâÓöąŇżĆˇ˘żőżÎµĽÖÂÎŢ·¨ĐŢÂúѧ·ÖŁ¬»ňŐßÖ±˝Ó±»Ń§ĐŁÍËѧŁ¬×îşóÎŢ·¨±ĎҵÄò»µ˝±Ďҵ֤ˇŁ´ËʱµÄÄăŇ»¶¨ĘÖ×ăÎ޴룬ŇňÎŞÁôѧһłˇŁ¬Ă»ÓĐ»ńµĂ±Ďҵ֤ŇÔĽ°Ń§ŔúÖ¤Ă÷żĎ¶¨ĘÇÎŢ·¨¸ř×ÔĽşşÍ¸¸Ä¸Ň»¸ö˝»´úµÄˇŁ
ˇľ¸´żĚÔĽş˛»ôĆŐ˝đËą´óѧłÉĽ¨µĄĐĹ·â,Buy The Johns Hopkins University Transcriptsˇż
ąşÂňČŐş«łÉĽ¨µĄˇ˘Ó˘ąú´óѧłÉĽ¨µĄˇ˘ĂŔąú´óѧłÉĽ¨µĄˇ˘°ÄÖŢ´óѧłÉĽ¨µĄˇ˘ĽÓÄĂ´ó´óѧłÉĽ¨µĄŁ¨q΢1954292140Ł©ĐÂĽÓĆ´óѧłÉĽ¨µĄˇ˘ĐÂÎ÷ŔĽ´óѧłÉĽ¨µĄˇ˘°®¶űŔĽłÉĽ¨µĄˇ˘Î÷°ŕŃŔłÉĽ¨µĄˇ˘µÂąúłÉĽ¨µĄˇŁłÉĽ¨µĄµÄŇâŇĺÖ÷ŇŞĚĺĎÖÔÚÖ¤Ă÷ѧϰÄÜÁ¦ˇ˘ĆŔąŔѧĘő±łľ°ˇ˘ŐąĘľ×ŰşĎËŘÖʡ˘Ěá¸ß¼ȡÂĘŁ¬ŇÔĽ°ĘÇ×÷ÎŞÁôĐĹČĎÖ¤ÉęÇë˛ÄÁϵÄŇ»˛ż·ÖˇŁ
ÔĽş˛»ôĆŐ˝đËą´óѧłÉĽ¨µĄÄÜą»ĚĺĎÖÄúµÄµÄѧϰÄÜÁ¦Ł¬°üŔ¨ÔĽş˛»ôĆŐ˝đËą´óѧżÎłĚłÉĽ¨ˇ˘×¨ŇµÄÜÁ¦ˇ˘ŃĐľżÄÜÁ¦ˇŁŁ¨q΢1954292140Ł©ľßĚĺŔ´ËµŁ¬łÉĽ¨±¨¸ćµĄÍ¨łŁ°üş¬Ń§ÉúµÄѧϰĽĽÄÜÓëĎ°ąßˇ˘¸÷żĆłÉĽ¨ŇÔĽ°ŔĎʦĆŔÓďµČ˛ż·ÖŁ¬Ňň´ËŁ¬łÉĽ¨µĄ˛»˝öĘÇѧÉúѧĘőÄÜÁ¦µÄÖ¤Ă÷Ł¬Ň˛ĘÇĆŔąŔѧÉúĘÇ·ńĘĘşĎÄł¸ö˝ĚÓýĎîÄżµÄÖŘŇŞŇŔľÝŁˇ
ÎŇĂÇłĐŵ˛ÉÓõÄĘÇѧУ԰ćÖ˝ŐĹŁ¨Ô°ćÖ˝Öʡ˘µ×É«ˇ˘ÎĆ·Ł©ÎŇĂÇą¤ł§ÓµÓĐČ«Ě×˝řżÚÔ×°É豸Ł¬ĚŘĘ⹤ŇŐ¶ĽĘDzÉÓò»Í¬»úĆ÷ÖĆ×÷Ł¬·ÂŐć¶Č»ů±ľżÉŇÔ´ďµ˝100%Ł¬ËůÓĐłÉĆ·ŇÔĽ°ą¤ŇŐЧąű¶ĽżÉĚáÇ°¸řżÍ»§ŐąĘľŁ¬˛»ÂúŇâżÉŇÔ¸ůľÝżÍ»§ŇŞÇó˝řĐе÷ŐűŁ¬Ö±µ˝ÂúŇâÎŞÖąŁˇ
ˇľÖ÷ÓŞĎîÄżˇż
Ň»ˇ˘ą¤×÷δȷ¶¨Ł¬»ŘąúĐčĎȸř¸¸Ä¸ˇ˘Ç×ĆÝĹóÓŃż´ĎÂÎÄĆľµÄÇéżöŁ¬°ěŔí±Ďҵ֤|°ěŔíÎÄĆľ: Âň´óѧ±Ďҵ֤|Âň´óѧÎÄĆľˇľqޱ1954292140ˇżÔĽş˛»ôĆŐ˝đËą´óѧѧλ֤Ă÷ĘéČçşÎ°ěŔíÉęÇ룿
¶ţˇ˘»Řąú˝řË˝Ćóˇ˘ÍâĆóˇ˘×ÔĽş×öÉúŇâµÄÇéżöŁ¬ŐâĐ©µĄÎ»ĘDz»˛éŃŻ±Ďҵ֤ŐćαµÄŁ¬¶řÇŇąúÄÚĂ»ÓĐÇţµŔČĄ˛éŃŻąúÍâÎÄĆľµÄŐćĽŮŁ¬Ň˛˛»ĐčŇŞĚáą©Őćʵ˝ĚÓý˛żČĎÖ¤ˇŁĽřÓÚ´ËŁ¬°ěŔíĂŔąúłÉĽ¨µĄÔĽş˛»ôĆŐ˝đËą´óѧ±Ďҵ֤ˇľqޱ1954292140ˇżąúÍâ´óѧ±Ďҵ֤, ÎÄĆľ°ěŔí, ąúÍâÎÄĆľ°ěŔí, ÁôĐĹÍřČĎÖ¤The Influence off Flexible Work Policies
The Influence off Flexible Work Policiessales480687
?
This topic explores how flexible work policiesˇŞsuch as remote work, flexible hours, and hybrid modelsˇŞare transforming modern workplaces. It examines the impact on employee productivity, job satisfaction, work-life balance, and organizational performance. The topic also addresses challenges such as communication gaps, maintaining company culture, and ensuring accountability. Additionally, it highlights how flexible work arrangements can attract top talent, promote inclusivity, and adapt businesses to an evolving global workforce. Ultimately, it reflects the shift in how and where work gets done in the 21st century.Measurecamp Copenhagen - Consent Context
Measurecamp Copenhagen - Consent ContextHuman37
?
Measurecamp Copenhagen 2025 presentation by Glenn Vanderlinden, Human37Artigo - Playing to Win.planejamento docx
Artigo - Playing to Win.planejamento docxKellyXavier15
?
Excelente artifo para quem est¨˘ iniciando processo de aquisi??ode planejamento estrat¨¦gicoBoost Business Efficiency with Professional Data Entry Services
Boost Business Efficiency with Professional Data Entry Serviceseloiacs eloiacs
?
Boost Business Efficiency with Professional Data Entry Services
In todayˇŻs digital-first world, businesses generate and handle massive amounts of data every day ˇŞ customer records, sales data, inventory logs, survey results, and much more. But raw data has no value unless it is well-organized, accurate, and easily accessible. ThatˇŻs where professional data entry services come in.
By outsourcing data entry tasks to experts, businesses can streamline operations, reduce manual errors, and improve overall efficiency ˇŞ while focusing their internal resources on core activities like growth and customer engagement.
What Are Data Entry Services?
Data entry services refer to the process of converting information from various formats (handwritten, scanned, PDF, image, or audio) into structured, digital formats such as Excel sheets, CRM databases, or cloud storage systems. This work may be done online or offline, manually or using automation tools, depending on the clientˇŻs requirements.
Popular Data Entry Services Include:
Manual data entry from paper documents or scanned files
Online data entry directly into websites, forms, or portals
Offline data entry in formats like MS Word, Excel, or custom software
Product data entry for eCommerce platforms like Shopify, Amazon, and Flipkart
Document and image conversion into editable formats
Data cleansing and validation to remove duplicates and fix errors
Remote data entry support for real-time operations
CRM and ERP data management
These services are essential for organizing business data and making it usable for analysis, reporting, and decision-making.
Who Can Benefit from Data Entry Services?
Outsourcing data entry is not limited to any one industry ˇŞ it's a universal need for businesses of all types and sizes. Here are some examples:
eCommerce Businesses ¨C For managing product catalogs, inventory updates, pricing, and customer orders.
Healthcare Providers ¨C For digitizing patient records, prescriptions, and insurance documents.
Education Institutes ¨C To maintain student records, exam results, and staff data.
Financial Services ¨C For processing invoices, bank statements, transaction records.
Real Estate Companies ¨C To handle property listings, legal paperwork, client records.
Research & Marketing Firms ¨C To compile survey data, leads, and analytics reports.
Even startups and freelancers often require virtual data entry services to stay organized and competitive.
Top Benefits of Outsourcing Data Entry Services
Outsourcing data entry work to a professional company or virtual assistant offers multiple benefits ˇŞ whether you're running a small business or managing a large enterprise.
1. Reduced Costs
Maintaining an in-house data entry team means salaries, hardware, training, and software expenses. Outsourcing eliminates these costs and provides flexible, pay-as-you-go solutions.
NVIDIA Triton Inference Server, a game-changing platform for deploying AI mod...
NVIDIA Triton Inference Server, a game-changing platform for deploying AI mod...Tamanna36
?
NVIDIA Triton Inference Server! ?
Learn how Triton streamlines AI model deployment with dynamic batching, support for TensorFlow, PyTorch, ONNX, and more, plus GPU-optimized performance. From YOLO11 object detection to NVIDIA DynamoˇŻs future, itˇŻs your guide to scalable AI inference.
Check out the slides and share your thoughts! ?
#AI #NVIDIA #TritonInferenceServer #MachineLearningPresentation by Tariq & Mohammed (1).pptx
Presentation by Tariq & Mohammed (1).pptxAbooddSandoqaa
?
this presenration is talking about data and analaysis and caucusus analysis of the rotten egg tommetos and viral infections Data Visualisation in data science for students
Data Visualisation in data science for studentsconfidenceascend
?
Data visualisation is explained in a simple manner.Ad
Cluster Analysis
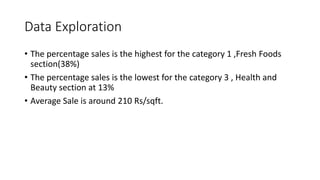
- 2. Data Exploration ? The percentage sales is the highest for the category 1 ,Fresh Foods section(38%) ? The percentage sales is the lowest for the category 3 , Health and Beauty section at 13% ? Average Sale is around 210 Rs/sqft.
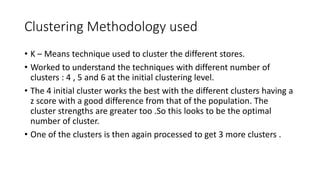
- 3. Clustering Methodology used ? K ¨C Means technique used to cluster the different stores. ? Worked to understand the techniques with different number of clusters : 4 , 5 and 6 at the initial clustering level. ? The 4 initial cluster works the best with the different clusters having a z score with a good difference from that of the population. The cluster strengths are greater too .So this looks to be the optimal number of cluster. ? One of the clusters is then again processed to get 3 more clusters .
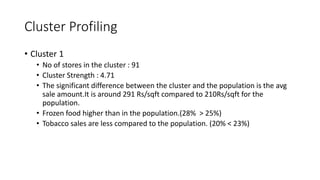
- 4. Cluster Profiling ? Cluster 1 ? No of stores in the cluster : 91 ? Cluster Strength : 4.71 ? The significant difference between the cluster and the population is the avg sale amount.It is around 291 Rs/sqft compared to 210Rs/sqft for the population. ? Frozen food higher than in the population.(28% > 25%) ? Tobacco sales are less compared to the population. (20% < 23%)
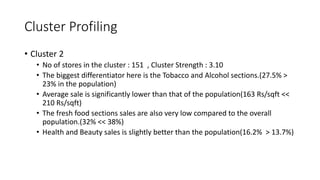
- 5. Cluster Profiling ? Cluster 2 ? No of stores in the cluster : 151 , Cluster Strength : 3.10 ? The biggest differentiator here is the Tobacco and Alcohol sections.(27.5% > 23% in the population) ? Average sale is significantly lower than that of the population(163 Rs/sqft << 210 Rs/sqft) ? The fresh food sections sales are also very low compared to the overall population.(32% << 38%) ? Health and Beauty sales is slightly better than the population(16.2% > 13.7%)
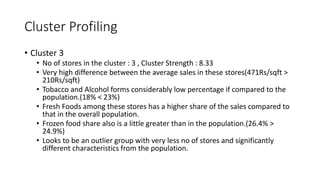
- 6. Cluster Profiling ? Cluster 3 ? No of stores in the cluster : 3 , Cluster Strength : 8.33 ? Very high difference between the average sales in these stores(471Rs/sqft > 210Rs/sqft) ? Tobacco and Alcohol forms considerably low percentage if compared to the population.(18% < 23%) ? Fresh Foods among these stores has a higher share of the sales compared to that in the overall population. ? Frozen food share also is a little greater than in the population.(26.4% > 24.9%) ? Looks to be an outlier group with very less no of stores and significantly different characteristics from the population.
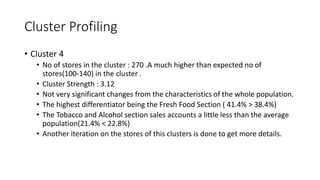
- 7. Cluster Profiling ? Cluster 4 ? No of stores in the cluster : 270 .A much higher than expected no of stores(100-140) in the cluster . ? Cluster Strength : 3.12 ? Not very significant changes from the characteristics of the whole population. ? The highest differentiator being the Fresh Food Section ( 41.4% > 38.4%) ? The Tobacco and Alcohol section sales accounts a little less than the average population(21.4% < 22.8%) ? Another iteration on the stores of this clusters is done to get more details.
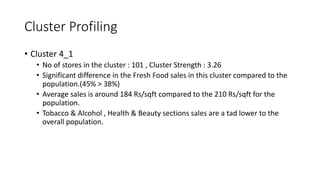
- 8. Cluster Profiling ? Cluster 4_1 ? No of stores in the cluster : 101 , Cluster Strength : 3.26 ? Significant difference in the Fresh Food sales in this cluster compared to the population.(45% > 38%) ? Average sales is around 184 Rs/sqft compared to the 210 Rs/sqft for the population. ? Tobacco & Alcohol , Health & Beauty sections sales are a tad lower to the overall population.
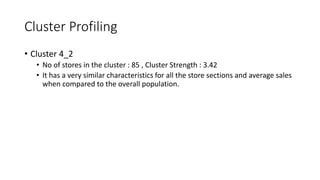
- 9. Cluster Profiling ? Cluster 4_2 ? No of stores in the cluster : 85 , Cluster Strength : 3.42 ? It has a very similar characteristics for all the store sections and average sales when compared to the overall population.
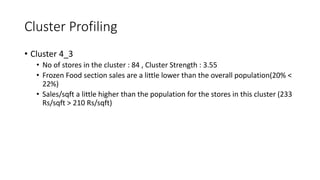
- 10. Cluster Profiling ? Cluster 4_3 ? No of stores in the cluster : 84 , Cluster Strength : 3.55 ? Frozen Food section sales are a little lower than the overall population(20% < 22%) ? Sales/sqft a little higher than the population for the stores in this cluster (233 Rs/sqft > 210 Rs/sqft)
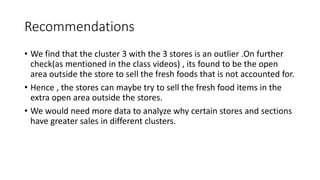
- 11. Recommendations ? We find that the cluster 3 with the 3 stores is an outlier .On further check(as mentioned in the class videos) , its found to be the open area outside the store to sell the fresh foods that is not accounted for. ? Hence , the stores can maybe try to sell the fresh food items in the extra open area outside the stores. ? We would need more data to analyze why certain stores and sections have greater sales in different clusters.