Cluto presentation
?Download as PPTX, PDF?
1 like?2,347 views

CLUTO is a software toolkit used for clustering high-dimensional datasets and analyzing cluster characteristics. It contains two main algorithms: Vcluster, which clusters based on the actual multi-dimensional data representation, and Scluster, which clusters based on a pre-computed similarity matrix. CLUTO can be run from the command line with various optional parameters to control the clustering method, analysis, and visualization of results.
![Calling Sequence
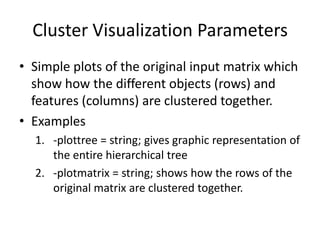
vcluster [optional parameters] MatrixFile
Nclusters
scluster [optional parameters] MatrixFile
NClusters](https://image.slidesharecdn.com/clutopresentation-130319153322-phpapp02/85/Cluto-presentation-4-320.jpg)


![roselineantai@ubuntu:~/JLSI/jlsi$ ./clusterscript2.sh
vcluster (CLUTO 2.1.1) Copyright 2001-03, Regents of the University of Minnesota
Matrix Information -----------------------------------------------------------
Name: Final_Results2/FinalOutput50dFinal.mat, #Rows: 59, #Columns: 59, #NonZeros: 3481
Options ----------------------------------------------------------------------
CLMethod=RB, CRfun=I2, SimFun=Cosine, #Clusters: 4
RowModel=None, ColModel=None, GrModel=SY-DIR, NNbrs=40
Colprune=1.00, EdgePrune=-1.00, VtxPrune=-1.00, MinComponent=5
CSType=Best, AggloFrom=0, AggloCRFun=I2, NTrials=10, NIter=10
Solution ---------------------------------------------------------------------
------------------------------------------------------------------------
4-way clustering: [I2=5.65e+01] [59 of 59], Entropy: 0.438, Purity: 0.729
------------------------------------------------------------------------
cid Size ISim ISdev ESim ESdev Entpy Purty | Sem Imp Deo Evo
------------------------------------------------------------------------
0 2 +0.779 +0.000 +0.638 +0.222 0.000 1.000 | 0 2 0 0
1 15 +0.918 +0.024 +0.853 +0.021 0.453 0.800 | 1 0 2 12
2 22 +0.923 +0.015 +0.866 +0.019 0.416 0.818 | 1 18 3 0
3 20 +0.923 +0.015 +0.869 +0.034 0.496 0.550 | 9 0 11 0
------------------------------------------------------------------------
--------------------------------------------------------------------------------
4-way clustering solution - Descriptive & Discriminating Features...
--------------------------------------------------------------------------------
Cluster 0, Size: 2, ISim: 0.779, ESim: 0.638
Descriptive: col00010 32.4%, col00039 22.7%, col00013 5.6%, col00019 3.9%, col00047 2.2%
Discriminating: col00010 53.5%, col00039 22.3%, col00013 2.5%, col00020 2.1%, col00012 1.4%
Cluster 1, Size: 15, ISim: 0.918, ESim: 0.853
Descriptive: col00013 11.3%, col00006 8.2%, col00019 7.9%, col00058 4.4%, col00047 4.2%
Discriminating: col00006 14.8%, col00007 7.4%, col00031 7.1%, col00029 6.6%, col00053 6.2%
Cluster 2, Size: 22, ISim: 0.923, ESim: 0.866
Descriptive: col00013 14.3%, col00020 7.1%, col00014 6.4%, col00019 4.4%, col00047 4.4%
Discriminating: col00020 7.0%, col00014 5.9%, col00013 5.5%, col00006 5.1%, col00010 4.3%
Cluster 3, Size: 20, ISim: 0.923, ESim: 0.869
Descriptive: col00013 8.9%, col00047 6.6%, col00019 5.2%, col00020 4.4%, col00014 3.8%
Discriminating: col00015 8.0%, col00013 7.4%, col00046 5.2%, col00006 5.0%, col00042 4.3%
--------------------------------------------------------------------------------
------------------------------------------------------------------------------
Hierarchical Tree that optimizes the I2 criterion function...
------------------------------------------------------------------------------
Sem Imp Deo Evo
------------------------------------
6
|---4
| |---2 1 18 3 0
| |---3 9 0 11 0
|-5
|-----1 1 0 2 12
|-----0 0 2 0 0
------------------------------------
------------------------------------------------------------------------------
Timing Information -----------------------------------------------------------
I/O: 0.004 sec
Clustering: 0.008 sec
Reporting: 0.316 sec](https://image.slidesharecdn.com/clutopresentation-130319153322-phpapp02/85/Cluto-presentation-11-320.jpg)


Cluto presentation
- 1. CLUTO A Clustering Toolkit By Roseline Antai
- 2. ? CLUTO is a software package which is used for clustering high dimensional datasets and for analyzing the characteristics of the various clusters.
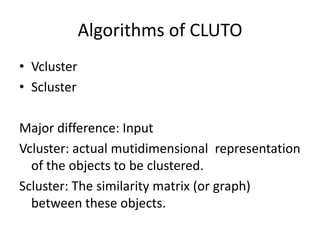
- 3. Algorithms of CLUTO ? Vcluster ? Scluster Major difference: Input Vcluster: actual mutidimensional representation of the objects to be clustered. Scluster: The similarity matrix (or graph) between these objects.
- 4. Calling Sequence vcluster [optional parameters] MatrixFile Nclusters scluster [optional parameters] MatrixFile NClusters
- 5. Optional Parameters ? Standard specification -paramname or ¨Cparamname = value ? Three categories: ¨C Clustering algorithm parameters ¨C Reporting and Analysis parameters ¨C Cluster Visualization parameters
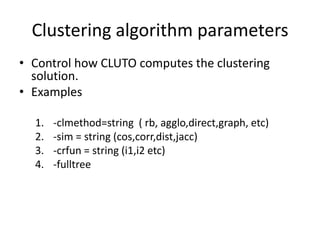
- 6. Clustering algorithm parameters ? Control how CLUTO computes the clustering solution. ? Examples 1. -clmethod=string ( rb, agglo,direct,graph, etc) 2. -sim = string (cos,corr,dist,jacc) 3. -crfun = string (i1,i2 etc) 4. -fulltree
- 7. Reporting and Analysis Parameters ? Control the amount of information that vcluster and scluster report about the clusters as well as the analysis performed on discovered clusters. ? Examples 1. -clustfile = string. ( Default is MatrixFile.clustering.Nclusters( or GraphFile)) 2. -clabelfile = string (name of the file thatˇŻs stores the labels of the columns. Used when ¨Cshowfeatues, - showsummaries or ¨Clabeltree are used)
- 8. 3. -rlabelfile=string 4. -rclassfile=string (Stores the labels of the rows ¨C objects to be clustered). 5. -showtree 6. -showfeatures (descriptive and discriminating)
- 9. Cluster Visualization Parameters ? Simple plots of the original input matrix which show how the different objects (rows) and features (columns) are clustered together. ? Examples 1. -plottree = string; gives graphic representation of the entire hierarchical tree 2. -plotmatrix = string; shows how the rows of the original matrix are clustered together.
- 10. A practical example ¨C ../cluto/Linux/vcluster -clmethod=rb -sim=cos - fulltree -rlabelfile=Final_Results/rlabelfile - rclassfile=Final_Results/classfile -showtree - plotformat=gif -plottree=Final_Results/Images/PT- Final10d -plotmatrix=Final_Results/Images/PM- Final10d -plotclusters=Final_Results/Images/PC- Final10d -showfeatures Final_Results/FinalOutput10d-Vt.mat 4
- 11. roselineantai@ubuntu:~/JLSI/jlsi$ ./clusterscript2.sh vcluster (CLUTO 2.1.1) Copyright 2001-03, Regents of the University of Minnesota Matrix Information ----------------------------------------------------------- Name: Final_Results2/FinalOutput50dFinal.mat, #Rows: 59, #Columns: 59, #NonZeros: 3481 Options ---------------------------------------------------------------------- CLMethod=RB, CRfun=I2, SimFun=Cosine, #Clusters: 4 RowModel=None, ColModel=None, GrModel=SY-DIR, NNbrs=40 Colprune=1.00, EdgePrune=-1.00, VtxPrune=-1.00, MinComponent=5 CSType=Best, AggloFrom=0, AggloCRFun=I2, NTrials=10, NIter=10 Solution --------------------------------------------------------------------- ------------------------------------------------------------------------ 4-way clustering: [I2=5.65e+01] [59 of 59], Entropy: 0.438, Purity: 0.729 ------------------------------------------------------------------------ cid Size ISim ISdev ESim ESdev Entpy Purty | Sem Imp Deo Evo ------------------------------------------------------------------------ 0 2 +0.779 +0.000 +0.638 +0.222 0.000 1.000 | 0 2 0 0 1 15 +0.918 +0.024 +0.853 +0.021 0.453 0.800 | 1 0 2 12 2 22 +0.923 +0.015 +0.866 +0.019 0.416 0.818 | 1 18 3 0 3 20 +0.923 +0.015 +0.869 +0.034 0.496 0.550 | 9 0 11 0 ------------------------------------------------------------------------ -------------------------------------------------------------------------------- 4-way clustering solution - Descriptive & Discriminating Features... -------------------------------------------------------------------------------- Cluster 0, Size: 2, ISim: 0.779, ESim: 0.638 Descriptive: col00010 32.4%, col00039 22.7%, col00013 5.6%, col00019 3.9%, col00047 2.2% Discriminating: col00010 53.5%, col00039 22.3%, col00013 2.5%, col00020 2.1%, col00012 1.4% Cluster 1, Size: 15, ISim: 0.918, ESim: 0.853 Descriptive: col00013 11.3%, col00006 8.2%, col00019 7.9%, col00058 4.4%, col00047 4.2% Discriminating: col00006 14.8%, col00007 7.4%, col00031 7.1%, col00029 6.6%, col00053 6.2% Cluster 2, Size: 22, ISim: 0.923, ESim: 0.866 Descriptive: col00013 14.3%, col00020 7.1%, col00014 6.4%, col00019 4.4%, col00047 4.4% Discriminating: col00020 7.0%, col00014 5.9%, col00013 5.5%, col00006 5.1%, col00010 4.3% Cluster 3, Size: 20, ISim: 0.923, ESim: 0.869 Descriptive: col00013 8.9%, col00047 6.6%, col00019 5.2%, col00020 4.4%, col00014 3.8% Discriminating: col00015 8.0%, col00013 7.4%, col00046 5.2%, col00006 5.0%, col00042 4.3% -------------------------------------------------------------------------------- ------------------------------------------------------------------------------ Hierarchical Tree that optimizes the I2 criterion function... ------------------------------------------------------------------------------ Sem Imp Deo Evo ------------------------------------ 6 |---4 | |---2 1 18 3 0 | |---3 9 0 11 0 |-5 |-----1 1 0 2 12 |-----0 0 2 0 0 ------------------------------------ ------------------------------------------------------------------------------ Timing Information ----------------------------------------------------------- I/O: 0.004 sec Clustering: 0.008 sec Reporting: 0.316 sec
- 12. Classfile and rlabelfile 0 Evo 1 Sem Imp 2 Imp 3 Deo Deo 4 Imp 5 Imp Deo 6 Deo 7 Imp Deo 8 Deo 9 Imp Sem 10 Deo 11 Sem Imp 12 Imp 13 Evo 14 15
- 15. The plot uses red to denote positive values and green to denote negative values. Bright red/green indicate large positive/negative values, whereas colors close to white indicate values close to zero.
- 16. Sem 0 Imp 1 Deo 2 Deo 3 Sem 4 Evo 5 Evo 6 Sem 7 Imp 8 Imp 9 Deo 10 Deo 11 Imp 12 Imp 13 Deo 14 Deo 15 Imp 16 Deo 17 Deo 18 Imp 19 Sem 20