complete frooti ppt
•Download as PPTX, PDF•
0 likes•1,108 views

This document discusses the distribution channels for Frooti juices in Pakistan. It outlines three distribution channels: 1) manufacturer to distributor to retailer, 2) manufacturer to wholesaler to retailer, and 3) manufacturer to retailer. It provides details on the types of Frooti juices, pricing strategies, key areas served by distributors and wholesalers, and costing and breakeven analyses for distributors and wholesalers. Retailers selected for each channel are also listed, along with their expected product shares and service levels.


complete frooti ppt
- 1. JUICES KAMAL IBRAHIM KHALID IQBAL FAROOQ AKRAM Distribution Channel
- 2. Overview Of The Presentation  Juices Distribution Channel  Types Of Juices  Pricing Strategy  3 Types Of Channel  Manufacturer to Distributor to Retailer  Manufacturer To Wholesaler to Retailer  Manufacturer to Retailer
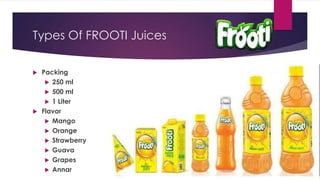
- 3. Types Of FROOTI Juices  Packing  250 ml  500 ml  1 Liter  Flavor  Mango  Orange  Strawberry  Guava  Grapes  Annar
- 4. Pricing of Distribution Channel End Consumer Retailer 10% Distributer 7% End Consumer Retailer 10% Distributer 7% Mango Guava 250 ml 10 9 8.37 250 ml 15 13.5 12.56 500 ml 18 16.2 15.07 500 ml 28 25.2 23.44 1 Liter 35 31.5 29.30 1 Liter 55 49.5 46.04 Orange Grapes 250 ml 10 9 8.37 250 ml 35 31.5 29.30 500 ml 18 16.2 15.07 500 ml 65 58.5 54.41 1 Liter 35 31.5 29.30 1 Liter 130 117 108.81 Strawberry Annar 250 ml 12 10.8 10.04 250 ml 35 31.5 29.30 500 ml 22 19.8 18.41 500 ml 65 58.5 54.41 1 Liter 44 39.6 36.83 1 Liter 130 117 108.81
- 5. Pricing of Wholesaler Channel End Consumer Retailer 10% Wholesaler 4% End Consumer Retailer 10% Wholesaler 4% Mango Guava 250 ml 10 9 8.64 250 ml 15 13.5 12.96 500 ml 18 16.2 15.552 500 ml 28 25.2 24.192 1 Liter 35 31.5 30.24 1 Liter 55 49.5 47.52 Orange Grapes 250 ml 10 9 8.64 250 ml 35 31.5 30.24 500 ml 18 16.2 15.552 500 ml 65 58.5 56.16 1 Liter 35 31.5 30.24 1 Liter 130 117 112.32 Strawberry Annar 250 ml 12 10.8 10.368 250 ml 35 31.5 30.24 500 ml 22 19.8 19.008 500 ml 65 58.5 56.16 1 Liter 44 39.6 38.016 1 Liter 130 117 112.32
- 6. Channel No: 1 Distributor Company Ware House Retailer End Consumer / Customer Negociation between Company & Distributor for (Credit Limit/Days) (%tageDiscounts) Negociation between Distributor & Retailer (Credit Limit/Days) (%tageDiscounts) Order Flow Goods Flow Payment Flow Ownership Financing Negotiation Possession Promotion
- 7. Areas Selected For Distributor  Distributor No 1  Model Town  Garden Town  DHA  Gulberg  Cantt  Wapda COLONY  Venus Housing  Gulshen e Jinnah  Engineers Town  Distributor No 2  Faisal Town  Joher Town  Wapda Town  Green Town  Valancia  TECH Socity  EDEN Villas  Behria Town  Sukh Chain Garden
- 8. Probability Of Product Share 250 ml => 85% 500 ml => 10% 1 Liter => 5%  Flavors  Mango 30%  Orange 25%  Strawberry 20%  Guava 15%  Grapes 5%  Annar 5%  TOTAL 100%
- 9. Wholesaler Costing and Breakeven Gross Profit %tage 4 % Setup Cost COST Breakeven Vans 6 725000 4350000 Units 125000 Rent In Advance 500000 Sales 12500000 Office Equip and Furniture 1000000 Other 500000 Monthly Target 15000000 TOTAL SETUP COST 6350000 %tage profit 7 Gross Profit on Target Achivement 1050000 Fixed Cost Fixed Expences 875000 Vans (6) 6 75000 450000 Net Profit 175000 Rent 125000 Yearly Profit 2100000 HR 250000 Others 50000 YEARLY PROFIT 2100000 TOTAL FIXED COST 875000 Pay Back Period / Year 3.02381 RETURN ON INVESTMENT 33.07087
- 10. Distributor Service Level  Bulk Breaking  Special Convince  Waiting And Delivery Time  Assortment and Varity
- 11. Channel No: 2 Wholesaler Company Ware House Retailer End Consumer / Customer Negociation between Company & Distributor for (Credit Limit/Days) (%tageDiscounts) Negotiation between Wholesaler & Retailer (Credit Limit/Days) (%tageDiscounts) Order Flow Goods Flow Payment Flow Ownership Financing Negotiation Possession Promotion
- 12. Areas Selected For Wholesaler  Multan Road Wholesaler  Maragzar Colony  Gulshen Park  Iteefaq Town  Hanjerwall  Said Pur  Sabza Zar  Saif Town  Sha Pur  Wholesaler No 1  Ilama Iqbal Town  Town Ship  Awan Town  High Court Society  Abbas Abbad  Mohan Wall
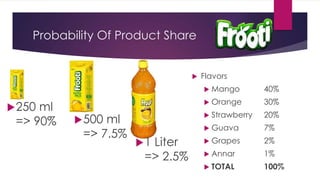
- 13. Probability Of Product Share 250 ml => 90% 500 ml => 7.5% 1 Liter => 2.5%  Flavors  Mango 40%  Orange 30%  Strawberry 20%  Guava 7%  Grapes 2%  Annar 1%  TOTAL 100%
- 14. Distributor Costing and Breakeven Gross Profit %tage 4% Setup Cost COST Breakeven Office Equip and Furniture 250000 Units 812500 Other 50000 Sales 8125000 TOTAL SETUP COST 300000 Monthly Target 8400000 Fixed Cost %tage profit 4 Rent 125000 Gross Profit on Target Achivement 336000 HR 150000 Fixed Expences 325000 Others 50000 Net Profit 11000 TOTAL FIXED COST 325000 Yearly Profit 132000 YEARLY PROFIT 132000 Pay Back Period / Year 2.272727 RETURN ON INVESTMENT 44
- 15. Wholesaler Service Level  Special Convince  Waiting And Delivery Time  Assortment and Varity
- 16. Channel No: 3 Retailer Company Ware House End Cnsumer Negociation between Company & Distributor for (Credit Limit/Days) (%tageDiscounts) Negotiation between Retailer (Credit Limit/Days) (%tageDiscounts) Order Flow Goods Flow Payment Flow Ownership Financing Negotiation Possession Promotion
- 17. Retailers Selected  Retailer  H Kareem Baksh  Jallal Sons  Metro  Makro
- 18. Probability Of Product Share 250 ml => 35% 500 ml => 45% 1 Liter => 20%  Flavors  Mango 15%  Orange 20%  Strawberry 15%  Guava 15%  Grapes 20%  Annar 15%  TOTAL 100%
- 19. Retailer Service Level  Bulk Breaking (Much Less)  Waiting And Delivery Time  Assortment and Varity  Customer Service  Information
- 20. ANY QUESTIONS !