Conditional formatting - Excel
- 1. Conditional Formatting First cut in analyzing your data
- 2. Recap Data Validation Headers Date Drop down list Cell Suggestion Error message
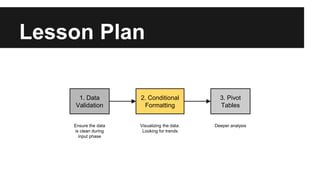
- 3. Lesson Plan 1. Data Validation 2. Conditional Formatting 3. Pivot Tables Ensure the data is clean during input phase Visualizing the data. Looking for trends Deeper analysis
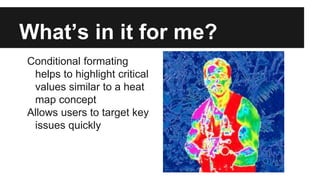
- 4. WhatŌĆÖs in it for me? Conditional formating helps to highlight critical values similar to a heat map concept Allows users to target key issues quickly
- 6. Example 1 Statuses that require attention
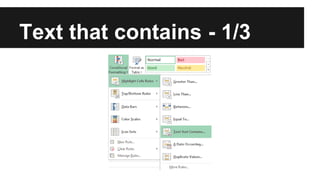
- 7. Text that contains - 1/3
- 8. Text that contains - 2/3
- 9. Text that contains - 3/3
- 10. Hands On Get those hands dirty!
- 11. Example 2 Heat map application to visualize data
- 12. Heat map - 1/1
- 13. Hands On Get those hands dirty!

