conference_MAF_22042014
- 1. Agenda Review of Literature Database Methodology procedure Lee Carter Model theory Lee Carter Model theory Lee A multivariate approach to project the long run relationship of mortality indices for Canadian provinces A. Ntamjokouen S.Haberman G. Consigli Vietri sul Mare, 24th Aprile 2014
- 2. Agenda Review of Literature Database Methodology procedure Lee Carter Model theory Lee Carter Model theory Lee Agenda Literature review on multi and single population; Analysis of Lee Carter parameters ; Order of integration for each of the 9 mortality indices using the ADF, PP, KPSS tests; Optimal value of lag of VAR; the Johansen cointegration test Analysis; The estimation of VECM and the VAR models and the forecasting of derived model. Pricing of annuities by cohorts for both males and females
- 3. Agenda Review of Literature Database Methodology procedure Lee Carter Model theory Lee Carter Model theory Lee Motivations One population model? Literature focuses on the modeling of 1 population mortality rates Lee Carter Model(1992); Lee Miller(2001); Booth Maindonal Smith Variant(2002); Hyndman and Ullah(2005); De Jong and Tickle(2006); Renshaw Haberman(2006) with cohort effect; Currie(2004) with P-Splines, and Currie(2006) with Age period Cohort; Cairns-Blake-Dowd(2009).
- 4. Agenda Review of Literature Database Methodology procedure Lee Carter Model theory Lee Carter Model theory Lee Literature Modeling mortality rates to improve the Lee Carter model Lazar and Denuit(2009): common trends between 5 age groups mortality; Darkiewicz(2004): Lee Carter validity as a cointegration approach; Njenga and sherris(2009): cointegration among Heligman Pollard; DŌĆÖAmato(2013): Multipopulation longevity risk among countries; Mortality indices Salhi(2010) and Zhou et al(2012) on the basis risk. Sharon S. Yang et al. (2009) pricing of longevity bonds derivatives among 4 countries;
- 5. Agenda Review of Literature Database Methodology procedure Lee Carter Model theory Lee Carter Model theory Lee Motivations Why multiprovinces longevity risk? Pricing of life insurance annuities accross countries or regions within a country; Engineering of longevity bonds derivatives; Hedging variations of life expectancy pattern.
- 6. Agenda Review of Literature Database Methodology procedure Lee Carter Model theory Lee Carter Model theory Lee Data We colllect data from Canadian Human Mortality Database from 9 provinces: Prince Edward Island(PEI), Nova Scotia(NS), News Brunswick(NB), Quebec(Q), Ontario(Q), Manitoba(M), Saskatchewan(S), Alberta(A), British Columbia(BC) from 1921 to 2009; It is managed by the Department of Demography of the Universit├® de Montreal in collaboration with the Max Plank Institute for Demographic Research and the Department of demography of the University of California at Berkeley(CHMD).
- 7. Agenda Review of Literature Database Methodology procedure Lee Carter Model theory Lee Carter Model theory Lee Data We retrieve the mortality indices produced by the Lee Carter model for the 9 mortality provinces; The determination of order of integration for each of the 9 mortality indices using the Augmented Dickey Fuller, Philips-Perron as well as KPSS Test; The computation of the optimal value of lag of the vector of autoregressive model; the Johansen cointegration test which test the cointegration rank and specify which variable will enter in the cointegrated equations and in the Vector of Error correction model; The estimation of VECM and the VAR models and the forecasting of derived model.
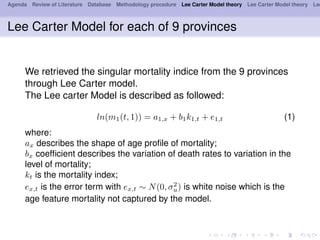
- 8. Agenda Review of Literature Database Methodology procedure Lee Carter Model theory Lee Carter Model theory Lee Lee Carter Model for each of 9 provinces We retrieved the singular mortality indice from the 9 provinces through Lee Carter model. The Lee carter Model is described as followed: ln(m1(t, 1)) = a1,x + b1k1,t + e1,t (1) where: ax describes the shape of age pro’¼üle of mortality; bx coef’¼ücient describes the variation of death rates to variation in the level of mortality; kt is the mortality index; ex,t is the error term with ex,t Ōł╝ N(0, Žā2 u) is white noise which is the age feature mortality not captured by the model.
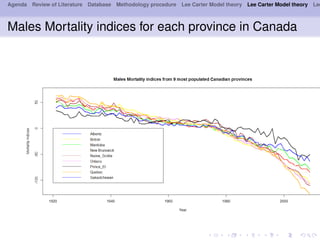
- 9. Agenda Review of Literature Database Methodology procedure Lee Carter Model theory Lee Carter Model theory Lee Males Mortality indices for each province in Canada
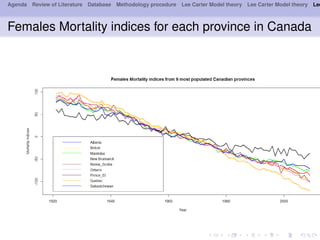
- 10. Agenda Review of Literature Database Methodology procedure Lee Carter Model theory Lee Carter Model theory Lee Females Mortality indices for each province in Canada
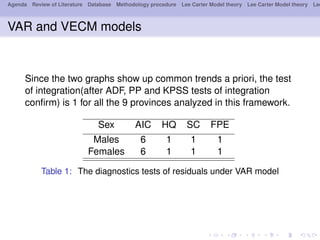
- 11. Agenda Review of Literature Database Methodology procedure Lee Carter Model theory Lee Carter Model theory Lee VAR and VECM models Since the two graphs show up common trends a priori, the test of integration(after ADF, PP and KPSS tests of integration con’¼ürm) is 1 for all the 9 provinces analyzed in this framework. Sex AIC HQ SC FPE Males 6 1 1 1 Females 6 1 1 1 Table 1: The diagnostics tests of residuals under VAR model
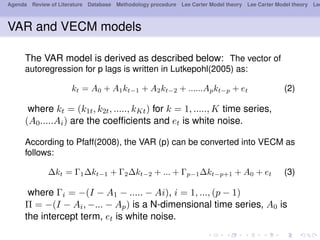
- 12. Agenda Review of Literature Database Methodology procedure Lee Carter Model theory Lee Carter Model theory Lee VAR and VECM models The VAR model is derived as described below: The vector of autoregression for p lags is written in Lutkepohl(2005) as: kt = A0 + A1ktŌłÆ1 + A2ktŌłÆ2 + ......ApktŌłÆp + et (2) where kt = (k1t, k2t, ....., kKt) for k = 1, ....., K time series, (A0.....Ai) are the coef’¼ücients and et is white noise. According to Pfaff(2008), the VAR (p) can be converted into VECM as follows: Ōłåkt = ╬ō1ŌłåktŌłÆ1 + ╬ō2ŌłåktŌłÆ2 + ... + ╬ōpŌłÆ1ŌłåktŌłÆp+1 + A0 + et (3) where ╬ōi = ŌłÆ(I ŌłÆ A1 ŌłÆ ..... ŌłÆ Ai), i = 1, ..., (p ŌłÆ 1) ╬Ā = ŌłÆ(I ŌłÆ Ai, ŌłÆ... ŌłÆ Ap) is a N-dimensional time series, A0 is the intercept term, et is white noise.
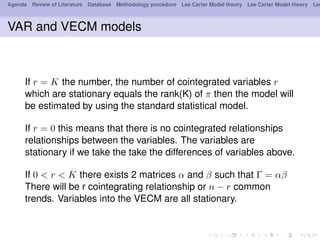
- 13. Agenda Review of Literature Database Methodology procedure Lee Carter Model theory Lee Carter Model theory Lee VAR and VECM models If r = K the number, the number of cointegrated variables r which are stationary equals the rank(K) of ŽĆ then the model will be estimated by using the standard statistical model. If r = 0 this means that there is no cointegrated relationships relationships between the variables. The variables are stationary if we take the take the differences of variables above. If 0 < r < K there exists 2 matrices ╬▒ and ╬▓ such that ╬ō = ╬▒╬▓ There will be r cointegrating relationship or n ŌłÆ r common trends. Variables into the VECM are all stationary.
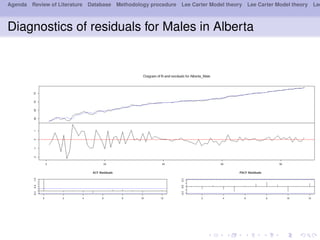
- 14. Agenda Review of Literature Database Methodology procedure Lee Carter Model theory Lee Carter Model theory Lee Diagnostics of residuals for Males in Alberta
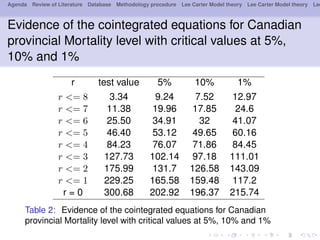
- 15. Agenda Review of Literature Database Methodology procedure Lee Carter Model theory Lee Carter Model theory Lee Evidence of the cointegrated equations for Canadian provincial Mortality level with critical values at 5%, 10% and 1% r test value 5% 10% 1% r <= 8 3.34 9.24 7.52 12.97 r <= 7 11.38 19.96 17.85 24.6 r <= 6 25.50 34.91 32 41.07 r <= 5 46.40 53.12 49.65 60.16 r <= 4 84.23 76.07 71.86 84.45 r <= 3 127.73 102.14 97.18 111.01 r <= 2 175.99 131.7 126.58 143.09 r <= 1 229.25 165.58 159.48 117.2 r = 0 300.68 202.92 196.37 215.74 Table 2: Evidence of the cointegrated equations for Canadian provincial Mortality level with critical values at 5%, 10% and 1%
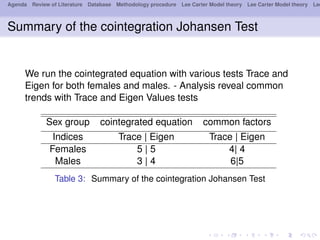
- 16. Agenda Review of Literature Database Methodology procedure Lee Carter Model theory Lee Carter Model theory Lee Summary of the cointegration Johansen Test We run the cointegrated equation with various tests Trace and Eigen for both females and males. - Analysis reveal common trends with Trace and Eigen Values tests Sex group cointegrated equation common factors Indices Trace | Eigen Trace | Eigen Females 5 | 5 4| 4 Males 3 | 4 6|5 Table 3: Summary of the cointegration Johansen Test
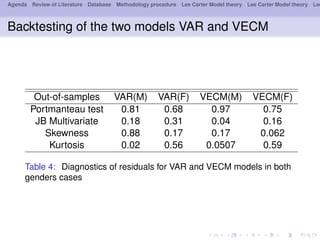
- 17. Agenda Review of Literature Database Methodology procedure Lee Carter Model theory Lee Carter Model theory Lee Backtesting of the two models VAR and VECM Out-of-samples VAR(M) VAR(F) VECM(M) VECM(F) Portmanteau test 0.81 0.68 0.97 0.75 JB Multivariate 0.18 0.31 0.04 0.16 Skewness 0.88 0.17 0.17 0.062 Kurtosis 0.02 0.56 0.0507 0.59 Table 4: Diagnostics of residuals for VAR and VECM models in both genders cases
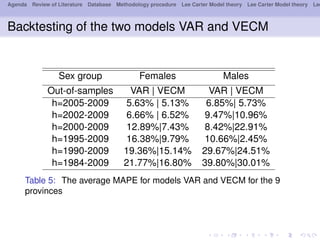
- 18. Agenda Review of Literature Database Methodology procedure Lee Carter Model theory Lee Carter Model theory Lee Backtesting of the two models VAR and VECM Sex group Females Males Out-of-samples VAR | VECM VAR | VECM h=2005-2009 5.63% | 5.13% 6.85%| 5.73% h=2002-2009 6.66% | 6.52% 9.47%|10.96% h=2000-2009 12.89%|7.43% 8.42%|22.91% h=1995-2009 16.38%|9.79% 10.66%|2.45% h=1990-2009 19.36%|15.14% 29.67%|24.51% h=1984-2009 21.77%|16.80% 39.80%|30.01% Table 5: The average MAPE for models VAR and VECM for the 9 provinces
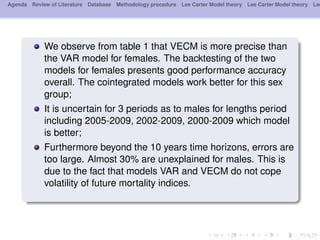
- 19. Agenda Review of Literature Database Methodology procedure Lee Carter Model theory Lee Carter Model theory Lee We observe from table 1 that VECM is more precise than the VAR model for females. The backtesting of the two models for females presents good performance accuracy overall. The cointegrated models work better for this sex group; It is uncertain for 3 periods as to males for lengths period including 2005-2009, 2002-2009, 2000-2009 which model is better; Furthermore beyond the 10 years time horizons, errors are too large. Almost 30% are unexplained for males. This is due to the fact that models VAR and VECM do not cope volatility of future mortality indices.
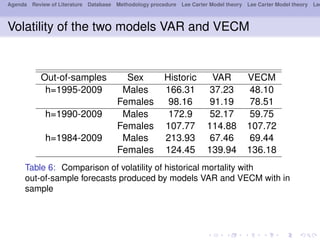
- 20. Agenda Review of Literature Database Methodology procedure Lee Carter Model theory Lee Carter Model theory Lee Volatility of the two models VAR and VECM Out-of-samples Sex Historic VAR VECM h=1995-2009 Males 166.31 37.23 48.10 Females 98.16 91.19 78.51 h=1990-2009 Males 172.9 52.17 59.75 Females 107.77 114.88 107.72 h=1984-2009 Males 213.93 67.46 69.44 Females 124.45 139.94 136.18 Table 6: Comparison of volatility of historical mortality with out-of-sample forecasts produced by models VAR and VECM with in sample
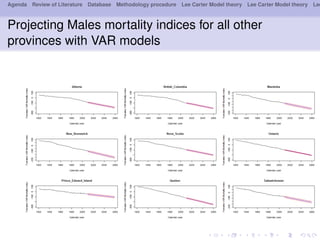
- 21. Agenda Review of Literature Database Methodology procedure Lee Carter Model theory Lee Carter Model theory Lee Projecting Males mortality indices for all other provinces with VAR models
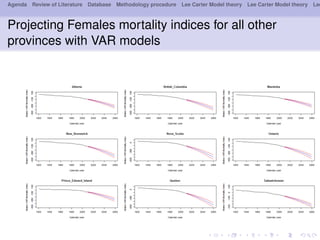
- 22. Agenda Review of Literature Database Methodology procedure Lee Carter Model theory Lee Carter Model theory Lee Projecting Females mortality indices for all other provinces with VAR models
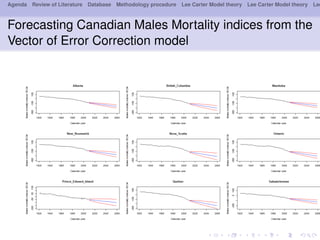
- 23. Agenda Review of Literature Database Methodology procedure Lee Carter Model theory Lee Carter Model theory Lee Forecasting Canadian Males Mortality indices from the Vector of Error Correction model
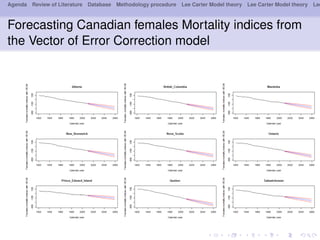
- 24. Agenda Review of Literature Database Methodology procedure Lee Carter Model theory Lee Carter Model theory Lee Forecasting Canadian females Mortality indices from the Vector of Error Correction model
- 25. Agenda Review of Literature Database Methodology procedure Lee Carter Model theory Lee Carter Model theory Lee Hypothesis on the pricing methodology The retirement age will be set to 65 age old regardless the cohort; Payments are made monthly and will be equal to 12; The actuarial present value of a yearly annuity of 1; The interest rate for the evaluation is 4% and the in’¼éation rate is about 2%.
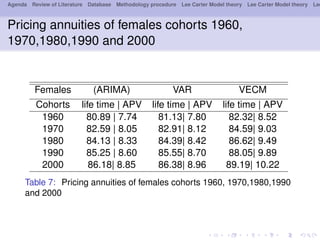
- 26. Agenda Review of Literature Database Methodology procedure Lee Carter Model theory Lee Carter Model theory Lee Pricing annuities of females cohorts 1960, 1970,1980,1990 and 2000 Females (ARIMA) VAR VECM Cohorts life time | APV life time | APV life time | APV 1960 80.89 | 7.74 81.13| 7.80 82.32| 8.52 1970 82.59 | 8.05 82.91| 8.12 84.59| 9.03 1980 84.13 | 8.33 84.39| 8.42 86.62| 9.49 1990 85.25 | 8.60 85.55| 8.70 88.05| 9.89 2000 86.18| 8.85 86.38| 8.96 89.19| 10.22 Table 7: Pricing annuities of females cohorts 1960, 1970,1980,1990 and 2000
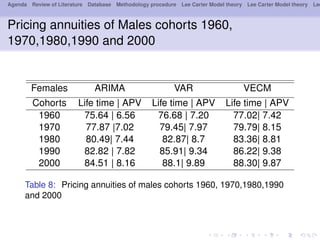
- 27. Agenda Review of Literature Database Methodology procedure Lee Carter Model theory Lee Carter Model theory Lee Pricing annuities of Males cohorts 1960, 1970,1980,1990 and 2000 Females ARIMA VAR VECM Cohorts Life time | APV Life time | APV Life time | APV 1960 75.64 | 6.56 76.68 | 7.20 77.02| 7.42 1970 77.87 |7.02 79.45| 7.97 79.79| 8.15 1980 80.49| 7.44 82.87| 8.7 83.36| 8.81 1990 82.82 | 7.82 85.91| 9.34 86.22| 9.38 2000 84.51 | 8.16 88.1| 9.89 88.30| 9.87 Table 8: Pricing annuities of males cohorts 1960, 1970,1980,1990 and 2000
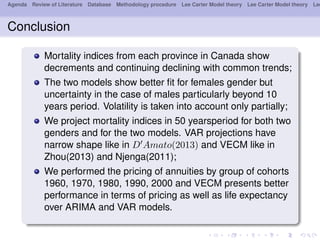
- 28. Agenda Review of Literature Database Methodology procedure Lee Carter Model theory Lee Carter Model theory Lee Conclusion Mortality indices from each province in Canada show decrements and continuing declining with common trends; The two models show better ’¼üt for females gender but uncertainty in the case of males particularly beyond 10 years period. Volatility is taken into account only partially; We project mortality indices in 50 yearsperiod for both two genders and for the two models. VAR projections have narrow shape like in D Amato(2013) and VECM like in Zhou(2013) and Njenga(2011); We performed the pricing of annuities by group of cohorts 1960, 1970, 1980, 1990, 2000 and VECM presents better performance in terms of pricing as well as life expectancy over ARIMA and VAR models.
- 29. Agenda Review of Literature Database Methodology procedure Lee Carter Model theory Lee Carter Model theory Lee THANK YOU FOR YOUR ATTENTION
