Consumer prefrence and choice
Download as ppt, pdf14 likes14,571 views

The document discusses consumer preferences and choice. It defines utility as the satisfaction derived from consumption and explains the concepts of total utility, marginal utility, and diminishing marginal utility. It contrasts cardinal and ordinal utility analysis, discussing indifference curves and how consumers seek to maximize utility subject to their budget constraint. The summary also mentions revealed preference theory, consumer equilibrium conditions, and how consumer surplus is measured as the difference between the maximum price consumers are willing to pay versus the actual price.

Consumer prefrence and choice
- 1. Chapter 4 Consumer Preferences and Choice
- 2. Lecture plan Objectives Consumer Choice Cardinal Utility Analysis Marginal Utility and Demand Curve Ordinal Utility Analysis Diminishing Marginal Rate of Substitution ConsumerŌĆÖs Equilibrium Revealed Preference Theory Consumer Surplus
- 3. Objectives To introduce the crux of consumer behaviour, choices and preferences. To explain the nuances of utility analysis, marginal utility, total utility and law of diminishing marginal utility. To explain the difference between cardinal and ordinal utility analyses of consumer behaviour. To discuss how consumer equilibrium is attained subject to budget constraint. To illustrate the concept of consumer surplus and its application in decision making.
- 4. Consumer Choice Given the prices of different commodities, consumers decide on the quantities of these commodities according to their paying capacity, and tastes and preferences . ConsumersŌĆÖ choices, tastes and preferences rests on the following assumptions: Completeness: A consumer would be able to state own preference or indifference between two distinct baskets of goods. Transitivity: An individual consumerŌĆÖs preferences are always consistent. Non-satiation: A consumer is never satiated permanently. More is always wanted; if ŌĆ£someŌĆØ is good, ŌĆ£moreŌĆØ of the good is better.
- 5. Consumer Choice Commodities are desired because of their utility Utility is the attribute of a commodity to satisfy or satiate a consumerŌĆÖs wants Utility is the satisfaction a consumer derives from consumption of a commodity Mathematically: utility is the function of the quantities of different commodities consumed: U= f(m1, n1, r1)
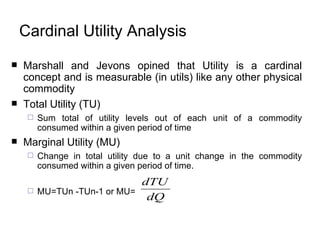
- 6. Cardinal Utility Analysis Marshall and Jevons opined that Utility is a cardinal concept and is measurable (in utils) like any other physical commodity Total Utility (TU) Sum total of utility levels out of each unit of a commodity consumed within a given period of time Marginal Utility (MU) Change in total utility due to a unit change in the commodity consumed within a given period of time. MU=TUn -TUn-1 or MU=
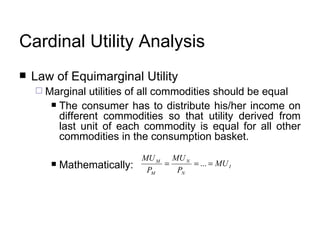
- 7. Cardinal Utility Analysis Law of Equimarginal Utility Marginal utilities of all commodities should be equal The consumer has to distribute his/her income on different commodities so that utility derived from last unit of each commodity is equal for all other commodities in the consumption basket. Mathematically:
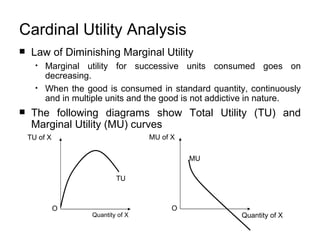
- 8. Cardinal Utility Analysis Law of Diminishing Marginal Utility Marginal utility for successive units consumed goes on decreasing. When the good is consumed in standard quantity, continuously and in multiple units and the good is not addictive in nature. The following diagrams show Total Utility (TU) and Marginal Utility (MU) curves Quantity of X TU of X O TU Quantity of X MU of X O MU
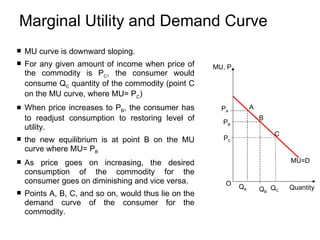
- 9. Marginal Utility and Demand Curve MU curve is downward sloping. For any given amount of income when price of the commodity is P C , the consumer would consume Q C quantity of the commodity (point C on the MU curve, where MU= P C ) When price increases to P B , the consumer has to readjust consumption to restoring level of utility. the new equilibrium is at point B on the MU curve where MU= P B As price goes on increasing, the desired consumption of the commodity for the consumer goes on diminishing and vice versa. Points A, B, C, and so on, would thus lie on the demand curve of the consumer for the commodity. P B MU=D Q B B P A Q A A C P C Q C MU, P Quantity O
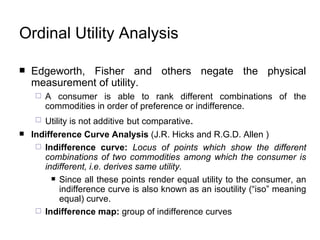
- 10. Edgeworth, Fisher and others negate the physical measurement of utility. A consumer is able to rank different combinations of the commodities in order of preference or indifference. Utility is not additive but comparative . Indifference Curve Analysis ( J.R. Hicks and R.G.D. Allen ) Indifference curve: Locus of points which show the different combinations of two commodities among which the consumer is indifferent, i.e. derives same utility. Since all these points render equal utility to the consumer, an indifference curve is also known as an isoutility (ŌĆ£isoŌĆØ meaning equal) curve. Indifference map: group of indifference curves Ordinal Utility Analysis
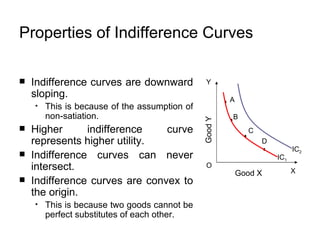
- 11. Properties of Indifference Curves Indifference curves are downward sloping. This is because of the assumption of non-satiation. Higher indifference curve represents higher utility. Indifference curves can never intersect. Indifference curves are convex to the origin. This is because two goods cannot be perfect substitutes of each other. B C A D X Y O Good X Good Y IC 2 IC 1
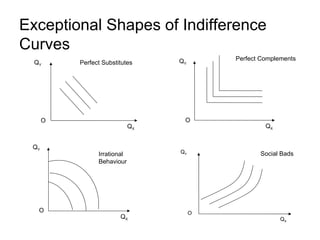
- 12. Exceptional Shapes of Indifference Curves Q X Q Y O Q X Q Y O Q X Q Y O Q X Q Y O Social Bads Perfect Substitutes Perfect Complements Irrational Behaviour
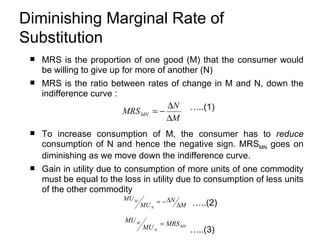
- 13. MRS is the proportion of one good (M) that the consumer would be willing to give up for more of another (N) MRS is the ratio between rates of change in M and N, down the indifference curve : ŌĆ” ..(1) To increase consumption of M, the consumer has to reduce consumption of N and hence the negative sign. MRS MN goes on diminishing as we move down the indifference curve. Gain in utility due to consumption of more units of one commodity must be equal to the loss in utility due to consumption of less units of the other commodity ŌĆ” ..(2) ŌĆ” ..(3) Diminishing Marginal Rate of Substitution
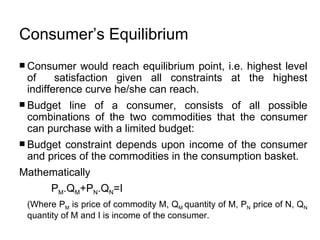
- 14. ConsumerŌĆÖs Equilibrium Consumer would reach equilibrium point, i.e. highest level of satisfaction given all constraints at the highest indifference curve he/she can reach. Budget line of a consumer, consists of all possible combinations of the two commodities that the consumer can purchase with a limited budget: Budget constraint depends upon income of the consumer and prices of the commodities in the consumption basket. Mathematically P M .Q M +P N .Q N =I (Where P M is price of commodity M, Q M quantity of M, P N price of N, Q N quantity of M and I is income of the consumer.
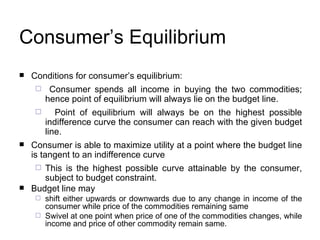
- 15. ConsumerŌĆÖs Equilibrium Conditions for consumerŌĆÖs equilibrium: Consumer spends all income in buying the two commodities; hence point of equilibrium will always lie on the budget line. Point of equilibrium will always be on the highest possible indifference curve the consumer can reach with the given budget line. Consumer is able to maximize utility at a point where the budget line is tangent to an indifference curve This is the highest possible curve attainable by the consumer, subject to budget constraint. Budget line may shift either upwards or downwards due to any change in income of the consumer while price of the commodities remaining same Swivel at one point when price of one of the commodities changes, while income and price of other commodity remain same.
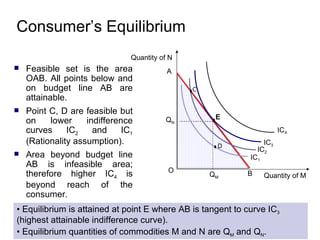
- 16. ConsumerŌĆÖs Equilibrium IC 1 Feasible set is the area OAB. All points below and on budget line AB are attainable. Point C, D are feasible but on lower indifference curves IC 2 and IC 1 (Rationality assumption). Area beyond budget line AB is infeasible area; therefore higher IC 4 is beyond reach of the consumer. Equilibrium is attained at point E where AB is tangent to curve IC 3 (highest attainable indifference curve). Equilibrium quantities of commodities M and N are Q M and Q N . Quantity of M Quantity of N O A B IC 4 Q M Q N IC 3 E IC 2 C D
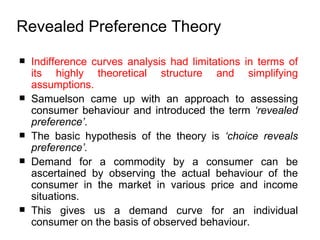
- 17. Indifference curves analysis had limitations in terms of its highly theoretical structure and simplifying assumptions. Samuelson came up with an approach to assessing consumer behaviour and introduced the term ŌĆśrevealed preferenceŌĆÖ . The basic hypothesis of the theory is ŌĆś choice reveals preferenceŌĆÖ. Demand for a commodity by a consumer can be ascertained by observing the actual behaviour of the consumer in the market in various price and income situations. This gives us a demand curve for an individual consumer on the basis of observed behaviour. Revealed Preference Theory
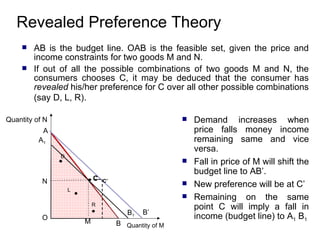
- 18. Revealed Preference Theory AB is the budget line. OAB is the feasible set, given the price and income constraints for two goods M and N. If out of all the possible combinations of two goods M and N, the consumers chooses C, it may be deduced that the consumer has revealed his/her preference for C over all other possible combinations (say D, L, R). Demand increases when price falls money income remaining same and vice versa. Fall in price of M will shift the budget line to ABŌĆÖ. New preference will be at CŌĆÖ Remaining on the same point C will imply a fall in income (budget line) to A 1 B 1 A B Quantity of M Quantity of N O D L R BŌĆÖ N M C A 1 B 1 CŌĆÖ
- 19. Consumer Surplus The difference between the price consumers are willing to pay and what they actually pay is called consumer surplus . Individual consumer surplus measures the gain that a consumer makes by purchasing a product at a price lower than what he/she had expected to pay. In a market the total consumer surplus measures the gain to the society due to the existence of a market transaction.
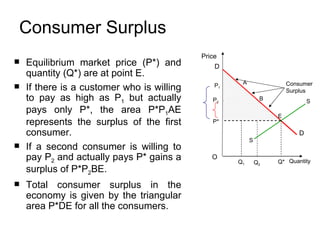
- 20. Consumer Surplus Equilibrium market price (P*) and quantity (Q*) are at point E. If there is a customer who is willing to pay as high as P 1 but actually pays only P*, the area P*P 1 AE represents the surplus of the first consumer. If a second consumer is willing to pay P 2 and actually pays P* gains a surplus of P*P 2 BE. Total consumer surplus in the economy is given by the triangular area P*DE for all the consumers. P 2 B Q 2 A P 1 Q 1 Price O Quantity D D S S P* Q* E Consumer Surplus
- 21. Summary Utility is the measure of satisfaction a consumer derives from consumption of a commodity ; it is an attribute of a commodity to satisfy a consumerŌĆÖs needs. According to cardinal school, utility is measurable like any other physical commodity . As per law of diminishing marginal utility , as you one consumes more and more units of a commodity, total utility would goes on increasing, but at a diminishing rate. As per law of equimarginal utility , a consumer will maximize utility when the marginal utility of the last unit of money spent on each commodity is equal to the marginal utility of the last unit of money spent on any other commodity. According to ordinal school, utility cannot be measured in physical units; it is possible to rank utility derived from various commodities. Indifference curves are downward sloping and convex to the origin; a higher indifference curve would represent higher utility and two indifference curves do not intersect each other.
- 22. Summary Marginal Rate of Substitution (MRS) shows the amount of a good that a consumer would be willing to give up for an additional unit of another commodity. Budget constraint to the consumer includes income of the consumer and prices of the commodities in the consumption basket. A change in any of these constraints would lead to a shift in the budget line. Such a shift can be of three types: upwards, downwards and swivelling. The consumer will be at equilibrium at a point where the budget line is tangent to the highest attainable indifference curve. According to the theory of revealed preferences, demand for a commodity by a consumer can be ascertained by observing the buying pattern of the consumer. Consumer surplus is equal to the difference between the price a consumer is willing to pay and the price he/she actually pays for a commodity.