Consumi petrolio 2016 01
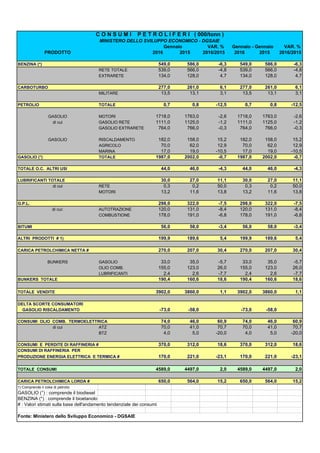
- 1. VAR. % VAR. % PRODOTTO 2016 2015 2016/2015 2016 2015 2016/2015 BENZINA (*) 549,0 586,0 -6,3 549,0 586,0 -6,3 RETE TOTALE 539,0 566,0 -4,8 539,0 566,0 -4,8 EXTRARETE 134,0 128,0 4,7 134,0 128,0 4,7 CARBOTURBO 277,0 261,0 6,1 277,0 261,0 6,1 MILITARE 13,5 13,1 3,1 13,5 13,1 3,1 PETROLIO TOTALE 0,7 0,8 -12,5 0,7 0,8 -12,5 GASOLIO MOTORI 1718,0 1763,0 -2,6 1718,0 1763,0 -2,6 di cui GASOLIO RETE 1111,0 1125,0 -1,2 1111,0 1125,0 -1,2 GASOLIO EXTRARETE 764,0 766,0 -0,3 764,0 766,0 -0,3 GASOLIO RISCALDAMENTO 182,0 158,0 15,2 182,0 158,0 15,2 AGRICOLO 70,0 62,0 12,9 70,0 62,0 12,9 MARINA 17,0 19,0 -10,5 17,0 19,0 -10,5 GASOLIO (°) TOTALE 1987,0 2002,0 -0,7 1987,0 2002,0 -0,7 TOTALE O.C. ALTRI USI 44,0 46,0 -4,3 44,0 46,0 -4,3 LUBRIFICANTI TOTALE 30,0 27,0 11,1 30,0 27,0 11,1 di cui RETE 0,3 0,2 50,0 0,3 0,2 50,0 MOTORI 13,2 11,6 13,8 13,2 11,6 13,8 G.P.L. 298,0 322,0 -7,5 298,0 322,0 -7,5 di cui: AUTOTRAZIONE 120,0 131,0 -8,4 120,0 131,0 -8,4 COMBUSTIONE 178,0 191,0 -6,8 178,0 191,0 -6,8 BITUMI 56,0 58,0 -3,4 56,0 58,0 -3,4 ALTRI PRODOTTI # 1) 199,9 189,6 5,4 199,9 189,6 5,4 CARICA PETROLCHIMICA NETTA # 270,0 207,0 30,4 270,0 207,0 30,4 BUNKERS GASOLIO 33,0 35,0 -5,7 33,0 35,0 -5,7 OLIO COMB. 155,0 123,0 26,0 155,0 123,0 26,0 LUBRIFICANTI 2,4 2,6 -7,7 2,4 2,6 -7,7 BUNKERS TOTALE 190,4 160,6 18,6 190,4 160,6 18,6 TOTALE VENDITE 3902,0 3860,0 1,1 3902,0 3860,0 1,1 DELTA SCORTE CONSUMATORI GASOLIO RISCALDAMENTO -73,0 -58,0 -73,0 -58,0 CONSUMI OLIO COMB. TERMOELETTRICA 74,0 46,0 60,9 74,0 46,0 60,9 di cui ATZ 70,0 41,0 70,7 70,0 41,0 70,7 BTZ 4,0 5,0 -20,0 4,0 5,0 -20,0 CONSUMI E PERDITE DI RAFFINERIA # 370,0 312,0 18,6 370,0 312,0 18,6 CONSUMI DI RAFFINERIA PER PRODUZIONE ENERGIA ELETTRICA E TERMICA # 170,0 221,0 -23,1 170,0 221,0 -23,1 TOTALE CONSUMI 4589,0 4497,0 2,0 4589,0 4497,0 2,0 CARICA PETROLCHIMICA LORDA # 650,0 564,0 15,2 650,0 564,0 15,2 1) Comprende il coke di petrolio GASOLIO (°) : comprende il biodiesel BENZINA (*) : comprende il bioetanolo # : Valori stimati sulla base dell'andamento tendenziale dei consumi Fonte: Ministero dello Sviluppo Economico - DGSAIE Gennaio - Gennaio C O N S U M I P E T R O L I F E R I ( 000/tonn ) MINISTERO DELLO SVILUPPO ECONOMICO - DGSAIE Gennaio