狠狠撸

狠狠撸Share a Scribd company logo
Facilitator:
Dr. James Daniel Paul
Professor – VIT Business School
VIT University – Chennai.
By
Ratish T
Student – VIT Business School,
VIT University – Chennai.
? The project is taken as a part of the course
work and the data used to implement the
control charts are the data collected form the
study conducted at TAFE, Tractors Division,
Bangalore during an Internship Period to
improve the Vehicle Turn Around Time(VTAT)
of supplier vehicles reaching the plant for
unloading the material.
? To understand the situation and performance
of different vehicles in unloading
performance.
? To identify the deviation so that the
constrained area or the areas of improvement
could be identified.
? To generate a control chart to monitor the
performance of the vehicles entering the
factory for unloading the materials.
data vtat;
input sno $ duration @@;
label sno = "Serial Number";
datalines;
TN49R3745a 19
KA406956a 11
KA52A018a 5
TN49R3745b 1050
KA52A018b 900
KA406956b 11
TN49R3745c 2918
TN49R3745d 160
KA406956c 375
KA52A018c 814
KA406956d 45
;
run;
title 'Individual moving Range Chart';
title2 'Time taken for Reporting to G1';
proc shewhart data=vtat;
irchart duration*sno;
run;
The graph is the process of Reporting to G1. Here the vehicle
numbers of different vehicles are in the horizontal axis and the
duration or the time taken for the process in the vertical axis.
The graph is for the process of G1 to Store Reporting
The graph is for the process of Store to Dock.
Process of Dock to Unloading
Process of Unloading to Exit
Control chart presentation ratish t
? Create a SAS data set, with variables a) the process variable (in this case, the
duration), and b) the sample label (in this case, vehicle number or S.no).
? Choose Solutions, Quality Improvement, Control Charts.
? For the Active Data Set, choose the appropriate data set from the Work
library, in this case WORK.VTAT.
? For Type of Control Chart, choose Mean and range charts.
? For Process variable, choose diameter.
? For Subgroup variable, choose the sample label, in this case, time.
? Since in this case we are creating the preliminary control chart using the
preliminary data sets, for Method of Establishing Control Limits, choose
Compute from the data….
? Click Run, print the Graph window.
Steps Involved in the Process
Control chart presentation ratish t

More Related Content

Viewers also liked (9)

PDF
Control chart example
Mujahed Alwagia
?
PPT
Control Charts28 Modified
valiamoley
?
PPT
Control chart ppt
Deepak Sarangi
?
PPTX
Hindi ppt kriya visheshan
Sai Srujan Dandyala
?
PPTX
adjectives ppt in hindi
papagauri
?
PDF
5 S "An effective tool to achieve Growth"
Mohit nandi
?
PDF
5's kaizen, 5S Hindi Presentation in pdf
Self-employed
?
PPTX
Hindi presentation
danikarj
?
PPTX
Netaji subhash chandra bose PPT in hindi
Abhishek Dev
?
Control chart example
Mujahed Alwagia
?
Control Charts28 Modified
valiamoley
?
Control chart ppt
Deepak Sarangi
?
Hindi ppt kriya visheshan
Sai Srujan Dandyala
?
adjectives ppt in hindi
papagauri
?
5 S "An effective tool to achieve Growth"
Mohit nandi
?
5's kaizen, 5S Hindi Presentation in pdf
Self-employed
?
Hindi presentation
danikarj
?
Netaji subhash chandra bose PPT in hindi
Abhishek Dev
?

Similar to Control chart presentation ratish t (14)

PPTX
Actionable information 1
LineView Academy (was OFX Academy)
?
PDF
IRJET- Study and Analysis of Time Factor in the Utilization Process
IRJET Journal
?
PPTX
Intersection analysis and data collection using jamar counter
Sajawal Bhatti
?
DOC
OEE Improvement
Pranav Dorle
?
PDF
Towards standardized statistical tables metadata-driven px-file production, R...
Tilastokeskus
?
PPT
SPC Training by D&H Engineers
D&H Engineers
?
PDF
Internship Report
Partha Pratim
?
DOCX
Exercise Problems for Chapter 5Numerical example on page 203Pe.docx
gitagrimston
?
PPTX
Internship PPT- Aastha,274187
Aastha Bhatia
?
PDF
Managing Earnings at Asset Light 3PLs
Lean Transit Consulting
?
PDF
Six sigma
MallikarjunRaoPanaba
?
PDF
Six sigma pedagogy
MallikarjunRaoPanaba
?
PPTX
Data analysis training
Vladimir Tsaklev
?
PPTX
Sohini Majumder_BB_Project_Production Increase.pptx
majumdersohini1
?
Actionable information 1
LineView Academy (was OFX Academy)
?
IRJET- Study and Analysis of Time Factor in the Utilization Process
IRJET Journal
?
Intersection analysis and data collection using jamar counter
Sajawal Bhatti
?
OEE Improvement
Pranav Dorle
?
Towards standardized statistical tables metadata-driven px-file production, R...
Tilastokeskus
?
SPC Training by D&H Engineers
D&H Engineers
?
Internship Report
Partha Pratim
?
Exercise Problems for Chapter 5Numerical example on page 203Pe.docx
gitagrimston
?
Internship PPT- Aastha,274187
Aastha Bhatia
?
Managing Earnings at Asset Light 3PLs
Lean Transit Consulting
?
Six sigma pedagogy
MallikarjunRaoPanaba
?
Data analysis training
Vladimir Tsaklev
?
Sohini Majumder_BB_Project_Production Increase.pptx
majumdersohini1
?
Ad

Recently uploaded (20)

PDF
624753984-Annex-A3-RPMS-Tool-for-Proficient-Teachers-SY-2024-2025.pdf
CristineGraceAcuyan
?
PPTX
Artificial intelligence Presentation1.pptx
SaritaMahajan5
?
PDF
NVIDIA Triton Inference Server, a game-changing platform for deploying AI mod...
Tamanna36
?
PPTX
Smart_Workplace_Assistant_Presentation (1).pptx
kiccha1703
?
PPTX
ppt somu_Jarvis_AI_Assistant_presen.pptx
MohammedumarFarhan
?
DOCX
Starbucks in the Indian market through its joint venture.
sales480687
?
PPTX
Mynd company all details what they are doing a
AniketKadam40952
?
DOCX
brigada_PROGRAM_25.docx the boys white house
RonelNebrao
?
PPTX
一比一原版(罢鲍颁毕业证书)开姆尼茨工业大学毕业证如何办理
taqyed
?
PDF
TCU EVALUATION FACULTY TCU Taguig City 1st Semester 2017-2018
MELJUN CORTES
?
PPTX
@Reset-Password.pptx presentakh;kenvtion
MarkLariosa1
?
PPTX
Indigo dyeing Presentation (2).pptx as dye
shreeroop1335
?
PPTX
Communication_Skills_Class10_Visual.pptx
namanrastogi70555
?
PPTX
english9quizw1-240228142338-e9bcf6fd.pptx
rossanthonytan130
?
PDF
11_L2_Defects_and_Trouble_Shooting_2014[1].pdf
gun3awan88
?
PPTX
PPT2 W1L2.pptx.........................................
palicteronalyn26
?
PDF
Blood pressure (3).pdfbdbsbsbhshshshhdhdhshshs
hernandezemma379
?
PDF
Informatics Market Insights AI Workforce.pdf
karizaroxx
?
PDF
Kafka Use Cases Real-World Applications
Accentfuture
?
PPTX
Parental Leave Policies & Research Bulgaria
Elitsa Dimitrova
?
624753984-Annex-A3-RPMS-Tool-for-Proficient-Teachers-SY-2024-2025.pdf
CristineGraceAcuyan
?
Artificial intelligence Presentation1.pptx
SaritaMahajan5
?
NVIDIA Triton Inference Server, a game-changing platform for deploying AI mod...
Tamanna36
?
Smart_Workplace_Assistant_Presentation (1).pptx
kiccha1703
?
ppt somu_Jarvis_AI_Assistant_presen.pptx
MohammedumarFarhan
?
Starbucks in the Indian market through its joint venture.
sales480687
?
Mynd company all details what they are doing a
AniketKadam40952
?
brigada_PROGRAM_25.docx the boys white house
RonelNebrao
?
一比一原版(罢鲍颁毕业证书)开姆尼茨工业大学毕业证如何办理
taqyed
?
TCU EVALUATION FACULTY TCU Taguig City 1st Semester 2017-2018
MELJUN CORTES
?
@Reset-Password.pptx presentakh;kenvtion
MarkLariosa1
?
Indigo dyeing Presentation (2).pptx as dye
shreeroop1335
?
Communication_Skills_Class10_Visual.pptx
namanrastogi70555
?
english9quizw1-240228142338-e9bcf6fd.pptx
rossanthonytan130
?
11_L2_Defects_and_Trouble_Shooting_2014[1].pdf
gun3awan88
?
PPT2 W1L2.pptx.........................................
palicteronalyn26
?
Blood pressure (3).pdfbdbsbsbhshshshhdhdhshshs
hernandezemma379
?
Informatics Market Insights AI Workforce.pdf
karizaroxx
?
Kafka Use Cases Real-World Applications
Accentfuture
?
Parental Leave Policies & Research Bulgaria
Elitsa Dimitrova
?
Ad

Control chart presentation ratish t

  • 1. Facilitator: Dr. James Daniel Paul Professor – VIT Business School VIT University – Chennai. By Ratish T Student – VIT Business School, VIT University – Chennai.
  • 2. ? The project is taken as a part of the course work and the data used to implement the control charts are the data collected form the study conducted at TAFE, Tractors Division, Bangalore during an Internship Period to improve the Vehicle Turn Around Time(VTAT) of supplier vehicles reaching the plant for unloading the material.
  • 3. ? To understand the situation and performance of different vehicles in unloading performance. ? To identify the deviation so that the constrained area or the areas of improvement could be identified. ? To generate a control chart to monitor the performance of the vehicles entering the factory for unloading the materials.
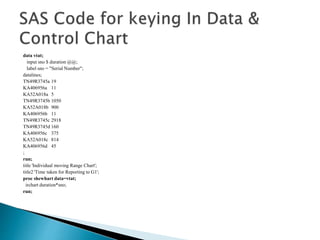
  • 4. data vtat; input sno $ duration @@; label sno = "Serial Number"; datalines; TN49R3745a 19 KA406956a 11 KA52A018a 5 TN49R3745b 1050 KA52A018b 900 KA406956b 11 TN49R3745c 2918 TN49R3745d 160 KA406956c 375 KA52A018c 814 KA406956d 45 ; run; title 'Individual moving Range Chart'; title2 'Time taken for Reporting to G1'; proc shewhart data=vtat; irchart duration*sno; run;
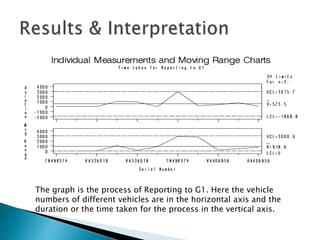
  • 5. The graph is the process of Reporting to G1. Here the vehicle numbers of different vehicles are in the horizontal axis and the duration or the time taken for the process in the vertical axis.
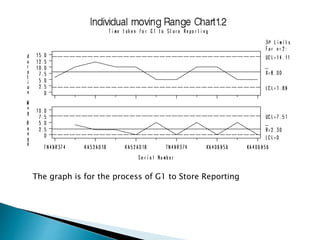
  • 6. The graph is for the process of G1 to Store Reporting
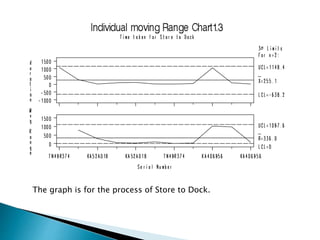
  • 7. The graph is for the process of Store to Dock.
  • 8. Process of Dock to Unloading
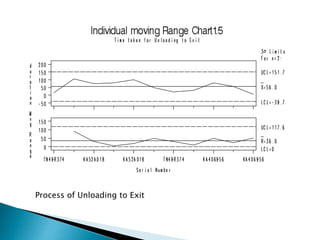
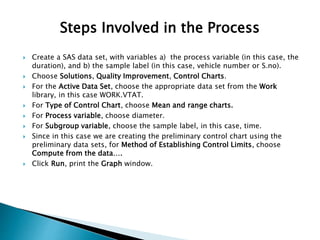
  • 11. ? Create a SAS data set, with variables a) the process variable (in this case, the duration), and b) the sample label (in this case, vehicle number or S.no). ? Choose Solutions, Quality Improvement, Control Charts. ? For the Active Data Set, choose the appropriate data set from the Work library, in this case WORK.VTAT. ? For Type of Control Chart, choose Mean and range charts. ? For Process variable, choose diameter. ? For Subgroup variable, choose the sample label, in this case, time. ? Since in this case we are creating the preliminary control chart using the preliminary data sets, for Method of Establishing Control Limits, choose Compute from the data…. ? Click Run, print the Graph window. Steps Involved in the Process