Correlation & Linear Regression
Download as pptx, pdf1 like455 views

This document discusses various statistical analyses that can be used to analyze the relationship between variables: 1. Bivariate correlation measures the strength and direction of association between two variables using Pearson's correlation coefficient (r). A significant correlation is when p<0.05. 2. Linear regression analysis uses linear equations to model relationships between a dependent variable and one or more independent variables. It identifies outliers that do not follow patterns. 3. Multiple regression extends linear regression to multiple independent variables, allowing analysis of their collective influence on a dependent variable. It provides measures like R and R-squared of the model's accuracy and fit.
1 of 12
Downloaded 19 times
Ad
Recommended
Capstone presentation
Capstone presentationstudent
╠²
The document investigates the factors influencing green purchase behavior among young consumers in North India, focusing on environmental attitudes, social influence, and perceived responsibility. It also discusses research limitations, including geographic constraints and age restrictions, and employs statistical methods like ANOVA and regression analysis to understand predictors of consumer behavior. The findings reveal that approximately 51.2% of variability in green purchase behavior can be explained by the identified factors.Spss6 multiple regression
Spss6 multiple regressionriddhu12
╠²
Multiple regression can be used to explore the relationship between a continuous dependent variable and multiple independent variables. There are three main types of multiple regression: standard, hierarchical, and stepwise. Standard multiple regression involves entering all independent variables into the equation at once to determine how much variance in the dependent variable is explained collectively. The document then provides an example using standard multiple regression to predict perceived stress from measures of control (mastery and PCOISS), finding the model significantly predicts stress and that mastery and PCOISS each uniquely contribute to the prediction.Increasing Power without Increasing Sample Size
Increasing Power without Increasing Sample Sizesmackinnon
╠²
The document discusses statistical power in research, focusing on how to increase it without expanding sample size by optimizing factors like sample size, mean square error, and controlling for confounding variables. It highlights the importance of using reliable measures, avoiding collinearity, and employing repeated measures designs to improve precision. The conclusion emphasizes that enhancing statistical power benefits both scientific integrity and researchers' careers.Association between-variables
Association between-variablesBorhan Uddin
╠²
The document discusses chi-square test and its properties. It defines chi-square as a non-parametric statistical test used for discrete data to test for independence and goodness of fit between observed and expected frequencies. The chi-square test has some key assumptions including independent random samples, nominal or ordinal level data, and no expected cell counts below 5. It is calculated by subtracting expected from observed frequencies, squaring the differences, and dividing by expected counts. The chi-square test can identify if there is a significant association between variables but does not measure the strength of the association.Association between-variables
Association between-variablesBorhan Uddin
╠²
The document discusses various statistical methods for analyzing relationships between variables, including chi-square tests, measures of association like lambda and gamma, and rank correlation. Chi-square tests can be used to test for independence and goodness of fit between nominal or ordinal variables. Measures like lambda and gamma range from 0 to 1 and indicate the strength of association while controlling for errors. Rank correlation assesses relationships between variables when only ordinal data is available by analyzing the agreement between ranks. Cross tabulation allows investigating patterns of bivariate association through distribution analysis.Regression
RegressionRohit Sharma
╠²
Regression analysis is a statistical method used to determine the relationship between variables. It allows one to predict the value of a dependent variable based on the value of one or more independent variables. There are three main uses of regression analysis: prediction, model specification, and parameter estimation. However, accurate prediction, model specification, and parameter estimation require that all relevant variables are accounted for in the data and model. Limitations in data can restrict the use of regression analysis for prediction.Correlational research
Correlational researchIhsan Ibadurrahman
╠²
The document discusses correlational research, which examines the relationship between two variables but cannot prove that one causes changes in the other. It explains that correlational studies involve identifying variables, stating questions or hypotheses, collecting data from a sample, calculating correlation coefficients to measure the strength of relationships between variables, and reporting the results. Researchers must be cautious not to assume that correlation necessarily implies causation.Econometrics chapter 8
Econometrics chapter 8Sehrish Chaudary
╠²
This chapter discusses various statistical tests used for multiple regression analysis, including:
1. Testing individual regression coefficients and the overall model significance.
2. Testing whether two or more coefficients are equal.
3. Testing if coefficients satisfy certain restrictions.
4. Testing the stability of a regression model over time using the Chow test.
5. Testing linear vs. log-linear functional forms using the MacKinnon-White-Davidson test.
The chapter outlines different statistical approaches like confidence intervals, F-tests, and t-tests to evaluate hypotheses about coefficients and models.R - Multiple Regression
R - Multiple RegressionLearnbay Datascience
╠²
Multiple regression is an advanced form of linear regression that analyzes the relationship between one response variable and multiple predictor variables. Using the lm() function in R, a regression model is created to determine the coefficients and predict the response variable based on provided predictor values. The document also outlines the syntax for the lm() function and provides an example equation for predicting outcomes based on specific inputs.Correlation analysis
Correlation analysis Divyanshu Singh
╠²
Correlation analysis quantifies the relationship between two or more variables. It is used to determine how much one variable predicts another and whether their relationship is positive or negative. The Pearson correlation coefficient (r) measures the strength and direction of linear relationships between variables. SPSS software enables statistical analysis and calculation of correlation coefficients to interpret relationships in data.Data Science - Part IV - Regression Analysis & ANOVA
Data Science - Part IV - Regression Analysis & ANOVADerek Kane
╠²
The document provides a comprehensive overview of regression analysis, particularly focusing on ordinary least squares (OLS) and its applications in various fields such as business and forecasting. It covers essential concepts including simple and multiple linear regression, key assumptions, the impact of multicollinearity, and techniques for model evaluation and correction. Additionally, it discusses the significance of interaction terms and the interpretation of regression coefficients, emphasizing the importance of proper model specification for accurate predictions.Correlation and regression
Correlation and regressionHuma Ansari
╠²
The document provides an overview of correlation and regression analysis, discussing their definitions, types, objectives, and methods of measurement. Correlation examines the relationship between two or more variables, while regression focuses on predicting unknown variables based on known variables, highlighting that correlation is limited in application compared to regression. Key differences include the nature of variable dependence and the range of correlation coefficients.Regression presentation
Regression presentationAllame Tabatabaei
╠²
A researcher conducted a study to investigate the relationship between anxiety, motivation, and writing performance. Multiple regression analysis was used to address: 1) how well anxiety and motivation predict writing performance, 2) which is the best predictor. Anxiety and motivation scores from 50 learners were collected via questionnaires and correlated with writing performance scores from essays. The regression model explained 15% of variance in writing performance, with anxiety making the largest unique contribution as the best predictor. Motivation's contribution was not statistically significant.Bias in Research Methods
Bias in Research Methods Centre for Social Initiative and Management
╠²
- The document discusses different types of sampling bias that can occur when collecting data samples to represent a population.
- There are biases that can affect parameter estimates, standard errors, confidence intervals, test statistics, and p-values. These are all related - a bias in one area like confidence intervals will lead to biases in other areas like test statistics.
- Five assumptions that can lead to bias if violated are: the presence of outliers, additivity and linearity of relationships, normality of data, homoscedasticity (equal variances), and independence of observations. Outliers, violations of linearity or additivity, and unequal variances can bias parameter estimates, standard errors, and test statistics.One-Way ANOVA: Conceptual Foundations
One-Way ANOVA: Conceptual Foundationssmackinnon
╠²
The document provides an overview of Analysis of Variance (ANOVA), including its definition, hypotheses, and conditions for application. It explains the calculation of the F statistic and the rationale behind using ANOVA instead of multiple t-tests to avoid inflated Type I error rates. Additionally, it covers the assumptions necessary for performing ANOVA and the need for follow-up 'post-hoc' tests to identify specific group differences.Covariance and correlation
Covariance and correlationRashid Hussain
╠²
The document discusses covariance and correlation, which describe the relationship between two variables. Covariance indicates whether variables are positively or inversely related, while correlation also measures the degree of their relationship. A positive covariance/correlation means variables move in the same direction, while a negative covariance/correlation means they move in opposite directions. Correlation coefficients range from 1 to -1, with 1 indicating a perfect positive correlation and -1 a perfect inverse correlation. The document provides formulas for calculating covariance and correlation and examples to demonstrate their use.Covariance vs Correlation
Covariance vs CorrelationAniruddha Deshmukh
╠²
Covariance is a measure of how two random variables change together, taking any value from -Ōł× to +Ōł×. Covariance can be affected by changing the units of the variables. Correlation is a scaled version of covariance that indicates the strength of the relationship between two variables on a scale of -1 to 1. Unlike covariance, correlation is not affected by changes in the location or scale of the variables and provides a standardized measure of their relationship. Correlation is therefore preferred over covariance as a measure of the relationship between two variables.Multicollinearity
MulticollinearityBernard Asia
╠²
This document discusses multicollinearity in econometrics. Multicollinearity occurs when there is a near-perfect linear relationship among independent variables. It can lead to unstable parameter estimates and high standard errors. Symptoms include high standard errors, unexpected parameter signs or magnitudes, and jointly significant but individually insignificant variables. Diagnosis involves examining variable correlations and testing joint significance. The variance inflation factor (VIF) measures the impact of multicollinearity, with values above 2 indicating a potential problem. Remedies include acquiring more data, dropping problematic variables, or reformulating the model, though these can introduce new issues. Multicollinearity alone does not invalidate estimates.Multiple linear regression
Multiple linear regressionAvjinder (Avi) Kaler
╠²
This document discusses multiple linear regression analysis. It begins by defining a multiple regression equation that describes the relationship between a response variable and two or more explanatory variables. It notes that multiple regression allows prediction of a response using more than one predictor variable. The document outlines key elements of multiple regression including visualization of relationships, statistical significance testing, and evaluating model fit. It provides examples of interpreting multiple regression output and using the technique to predict outcomes.Dependance Technique, Regression & Correlation
Dependance Technique, Regression & Correlation Qasim Raza
╠²
This document discusses different dependence techniques, including correlation and regression. It provides details on simple regression, multiple regression, and standard multiple regression. Correlation measures the relationship between two variables from -1 to 1. Regression analysis is used to predict a dependent variable from independent variables. Standard multiple regression evaluates the relationship between a set of independent variables and a dependent variable by entering all independent variables simultaneously.Econometric model ing
Econometric model ingMatt Grant
╠²
This document provides an overview of econometric modeling techniques. It discusses objectives of econometric modeling including empirical verification of economic theories and policy analysis. It also describes types of econometric models such as single-equation regression models, simultaneous-equation models, and time series models. Model building criteria and assumptions of single-equation regression models are outlined along with methods for dealing with violations of assumptions like multicollinearity and autocorrelation.Multiple Linear Regression
Multiple Linear RegressionIndus University
╠²
This document discusses multiple linear regression analysis conducted to assess staff satisfaction levels at an educational institution. A questionnaire was administered to staff across multiple locations. Factor analysis was used to identify the variables that best predict overall satisfaction. A regression model was developed using satisfaction as the dependent variable and questions regarding workplace expectations, resources, communication, recognition, development opportunities, and opinions as independent variables. The model was analyzed in SPSS and showed high explanatory power, with no issues of multicollinearity between predictors.Simple Regression.pptx
Simple Regression.pptxVictoria Bozhenko
╠²
The document explains simple regression analysis as a method for predicting the relationship between a dependent variable and one or more independent variables, emphasizing the importance of estimating parameters using the least squares principle. It outlines key statistics for model fit evaluation, including R-squared, F-test, and RMSE, while also discussing the significance of p-values in determining the relevance of predictors. Additionally, the concept of elasticity is introduced to illustrate the proportional changes between economic variables.Linear Correlation
Linear Correlation Tarek Tawfik Amin
╠²
The document discusses the concept of correlation between variables, categorizing them into dependent and independent types. It details various methods for analyzing relationships, including tabular, graphical, and numerical techniques, and explains how to interpret correlation coefficients and statistical significance. Examples are provided to illustrate correlation calculation and relationships in data, including positive, negative, and no correlation scenarios.Multiple regression presentation
Multiple regression presentationCarlo Magno
╠²
This document discusses multiple regression analysis and its use in predicting relationships between variables. Multiple regression allows prediction of a criterion variable from two or more predictor variables. Key aspects covered include the multiple correlation coefficient (R), squared correlation coefficient (R2), adjusted R2, regression coefficients, significance testing using t-tests and F-tests, and considerations for using multiple regression such as sample size and normality assumptions.Measure of Association
Measure of AssociationKalahandi University
╠²
The document discusses measures of statistical association, emphasizing the distinction between measures of association and statistical significance. It explains various coefficients, such as the Pearson correlation coefficient and the Spearman rank correlation coefficient, and their applications in analyzing relationships between variables. Additionally, it highlights the concept of the coefficient of determination (r┬▓), which quantifies the proportion of variance in the dependent variable explained by the independent variable(s).Correlation Analysis for MSc in Development Finance .pdf
Correlation Analysis for MSc in Development Finance .pdfErnestNgehTingum
╠²
The document discusses correlation analysis, focusing on its application in development finance and the relationship between variables. It covers the Pearson and Spearman correlation coefficients, their interpretations, causality, spurious correlation, and the coefficient of determination. The importance of distinguishing correlation from causation is emphasized, along with the limitations of each method.12943625.ppt
12943625.pptMokayceLimited
╠²
This document discusses various types and methods of measuring correlation between two variables. It describes correlation as a statistical tool to measure the degree of relationship between variables. Some key methods covered include scatter diagrams, Karl Pearson's coefficient of correlation, and Spearman's rank correlation coefficient. Positive and negative correlation examples are provided. The document also differentiates between simple, multiple, partial, and total correlation, as well as linear and non-linear correlation.Multiple Linear Regression
Multiple Linear Regression Vamshi krishna Guptha
╠²
This document discusses multiple linear regression analysis performed using SAS. It begins by outlining the assumptions of linear regression, including a linear relationship between variables, normality, no multicollinearity, and homoscedasticity. It then explains that multiple linear regression attempts to model the relationship between multiple explanatory variables and a response variable by fitting a linear equation to observed data. The document goes on to describe the regression analysis process, model selection, interpretation of outputs like R-squared and p-values, and evaluation of diagnostics like autocorrelation. It concludes by listing the predictor variables selected by the stepwise regression model and interpreting their parameter estimates.Regression analysis complete notes along with exampls
Regression analysis complete notes along with examplsS Gayu
╠²
The document covers regression analysis, explaining both simple and multiple linear regression, including key concepts like dependent and independent variables, correlation coefficients, and various statistical assumptions. It provides examples of regression equations and interpretation of model outputs, showcasing the significance of predictor variables and testing assumptions for normality, linearity, and homoscedasticity. Additionally, it discusses detecting outliers, high leverage points, and influential values using various metrics and plots.More Related Content
What's hot (14)
R - Multiple Regression
R - Multiple RegressionLearnbay Datascience
╠²
Multiple regression is an advanced form of linear regression that analyzes the relationship between one response variable and multiple predictor variables. Using the lm() function in R, a regression model is created to determine the coefficients and predict the response variable based on provided predictor values. The document also outlines the syntax for the lm() function and provides an example equation for predicting outcomes based on specific inputs.Correlation analysis
Correlation analysis Divyanshu Singh
╠²
Correlation analysis quantifies the relationship between two or more variables. It is used to determine how much one variable predicts another and whether their relationship is positive or negative. The Pearson correlation coefficient (r) measures the strength and direction of linear relationships between variables. SPSS software enables statistical analysis and calculation of correlation coefficients to interpret relationships in data.Data Science - Part IV - Regression Analysis & ANOVA
Data Science - Part IV - Regression Analysis & ANOVADerek Kane
╠²
The document provides a comprehensive overview of regression analysis, particularly focusing on ordinary least squares (OLS) and its applications in various fields such as business and forecasting. It covers essential concepts including simple and multiple linear regression, key assumptions, the impact of multicollinearity, and techniques for model evaluation and correction. Additionally, it discusses the significance of interaction terms and the interpretation of regression coefficients, emphasizing the importance of proper model specification for accurate predictions.Correlation and regression
Correlation and regressionHuma Ansari
╠²
The document provides an overview of correlation and regression analysis, discussing their definitions, types, objectives, and methods of measurement. Correlation examines the relationship between two or more variables, while regression focuses on predicting unknown variables based on known variables, highlighting that correlation is limited in application compared to regression. Key differences include the nature of variable dependence and the range of correlation coefficients.Regression presentation
Regression presentationAllame Tabatabaei
╠²
A researcher conducted a study to investigate the relationship between anxiety, motivation, and writing performance. Multiple regression analysis was used to address: 1) how well anxiety and motivation predict writing performance, 2) which is the best predictor. Anxiety and motivation scores from 50 learners were collected via questionnaires and correlated with writing performance scores from essays. The regression model explained 15% of variance in writing performance, with anxiety making the largest unique contribution as the best predictor. Motivation's contribution was not statistically significant.Bias in Research Methods
Bias in Research Methods Centre for Social Initiative and Management
╠²
- The document discusses different types of sampling bias that can occur when collecting data samples to represent a population.
- There are biases that can affect parameter estimates, standard errors, confidence intervals, test statistics, and p-values. These are all related - a bias in one area like confidence intervals will lead to biases in other areas like test statistics.
- Five assumptions that can lead to bias if violated are: the presence of outliers, additivity and linearity of relationships, normality of data, homoscedasticity (equal variances), and independence of observations. Outliers, violations of linearity or additivity, and unequal variances can bias parameter estimates, standard errors, and test statistics.One-Way ANOVA: Conceptual Foundations
One-Way ANOVA: Conceptual Foundationssmackinnon
╠²
The document provides an overview of Analysis of Variance (ANOVA), including its definition, hypotheses, and conditions for application. It explains the calculation of the F statistic and the rationale behind using ANOVA instead of multiple t-tests to avoid inflated Type I error rates. Additionally, it covers the assumptions necessary for performing ANOVA and the need for follow-up 'post-hoc' tests to identify specific group differences.Covariance and correlation
Covariance and correlationRashid Hussain
╠²
The document discusses covariance and correlation, which describe the relationship between two variables. Covariance indicates whether variables are positively or inversely related, while correlation also measures the degree of their relationship. A positive covariance/correlation means variables move in the same direction, while a negative covariance/correlation means they move in opposite directions. Correlation coefficients range from 1 to -1, with 1 indicating a perfect positive correlation and -1 a perfect inverse correlation. The document provides formulas for calculating covariance and correlation and examples to demonstrate their use.Covariance vs Correlation
Covariance vs CorrelationAniruddha Deshmukh
╠²
Covariance is a measure of how two random variables change together, taking any value from -Ōł× to +Ōł×. Covariance can be affected by changing the units of the variables. Correlation is a scaled version of covariance that indicates the strength of the relationship between two variables on a scale of -1 to 1. Unlike covariance, correlation is not affected by changes in the location or scale of the variables and provides a standardized measure of their relationship. Correlation is therefore preferred over covariance as a measure of the relationship between two variables.Multicollinearity
MulticollinearityBernard Asia
╠²
This document discusses multicollinearity in econometrics. Multicollinearity occurs when there is a near-perfect linear relationship among independent variables. It can lead to unstable parameter estimates and high standard errors. Symptoms include high standard errors, unexpected parameter signs or magnitudes, and jointly significant but individually insignificant variables. Diagnosis involves examining variable correlations and testing joint significance. The variance inflation factor (VIF) measures the impact of multicollinearity, with values above 2 indicating a potential problem. Remedies include acquiring more data, dropping problematic variables, or reformulating the model, though these can introduce new issues. Multicollinearity alone does not invalidate estimates.Multiple linear regression
Multiple linear regressionAvjinder (Avi) Kaler
╠²
This document discusses multiple linear regression analysis. It begins by defining a multiple regression equation that describes the relationship between a response variable and two or more explanatory variables. It notes that multiple regression allows prediction of a response using more than one predictor variable. The document outlines key elements of multiple regression including visualization of relationships, statistical significance testing, and evaluating model fit. It provides examples of interpreting multiple regression output and using the technique to predict outcomes.Dependance Technique, Regression & Correlation
Dependance Technique, Regression & Correlation Qasim Raza
╠²
This document discusses different dependence techniques, including correlation and regression. It provides details on simple regression, multiple regression, and standard multiple regression. Correlation measures the relationship between two variables from -1 to 1. Regression analysis is used to predict a dependent variable from independent variables. Standard multiple regression evaluates the relationship between a set of independent variables and a dependent variable by entering all independent variables simultaneously.Econometric model ing
Econometric model ingMatt Grant
╠²
This document provides an overview of econometric modeling techniques. It discusses objectives of econometric modeling including empirical verification of economic theories and policy analysis. It also describes types of econometric models such as single-equation regression models, simultaneous-equation models, and time series models. Model building criteria and assumptions of single-equation regression models are outlined along with methods for dealing with violations of assumptions like multicollinearity and autocorrelation.Multiple Linear Regression
Multiple Linear RegressionIndus University
╠²
This document discusses multiple linear regression analysis conducted to assess staff satisfaction levels at an educational institution. A questionnaire was administered to staff across multiple locations. Factor analysis was used to identify the variables that best predict overall satisfaction. A regression model was developed using satisfaction as the dependent variable and questions regarding workplace expectations, resources, communication, recognition, development opportunities, and opinions as independent variables. The model was analyzed in SPSS and showed high explanatory power, with no issues of multicollinearity between predictors.Similar to Correlation & Linear Regression (20)
Simple Regression.pptx
Simple Regression.pptxVictoria Bozhenko
╠²
The document explains simple regression analysis as a method for predicting the relationship between a dependent variable and one or more independent variables, emphasizing the importance of estimating parameters using the least squares principle. It outlines key statistics for model fit evaluation, including R-squared, F-test, and RMSE, while also discussing the significance of p-values in determining the relevance of predictors. Additionally, the concept of elasticity is introduced to illustrate the proportional changes between economic variables.Linear Correlation
Linear Correlation Tarek Tawfik Amin
╠²
The document discusses the concept of correlation between variables, categorizing them into dependent and independent types. It details various methods for analyzing relationships, including tabular, graphical, and numerical techniques, and explains how to interpret correlation coefficients and statistical significance. Examples are provided to illustrate correlation calculation and relationships in data, including positive, negative, and no correlation scenarios.Multiple regression presentation
Multiple regression presentationCarlo Magno
╠²
This document discusses multiple regression analysis and its use in predicting relationships between variables. Multiple regression allows prediction of a criterion variable from two or more predictor variables. Key aspects covered include the multiple correlation coefficient (R), squared correlation coefficient (R2), adjusted R2, regression coefficients, significance testing using t-tests and F-tests, and considerations for using multiple regression such as sample size and normality assumptions.Measure of Association
Measure of AssociationKalahandi University
╠²
The document discusses measures of statistical association, emphasizing the distinction between measures of association and statistical significance. It explains various coefficients, such as the Pearson correlation coefficient and the Spearman rank correlation coefficient, and their applications in analyzing relationships between variables. Additionally, it highlights the concept of the coefficient of determination (r┬▓), which quantifies the proportion of variance in the dependent variable explained by the independent variable(s).Correlation Analysis for MSc in Development Finance .pdf
Correlation Analysis for MSc in Development Finance .pdfErnestNgehTingum
╠²
The document discusses correlation analysis, focusing on its application in development finance and the relationship between variables. It covers the Pearson and Spearman correlation coefficients, their interpretations, causality, spurious correlation, and the coefficient of determination. The importance of distinguishing correlation from causation is emphasized, along with the limitations of each method.12943625.ppt
12943625.pptMokayceLimited
╠²
This document discusses various types and methods of measuring correlation between two variables. It describes correlation as a statistical tool to measure the degree of relationship between variables. Some key methods covered include scatter diagrams, Karl Pearson's coefficient of correlation, and Spearman's rank correlation coefficient. Positive and negative correlation examples are provided. The document also differentiates between simple, multiple, partial, and total correlation, as well as linear and non-linear correlation.Multiple Linear Regression
Multiple Linear Regression Vamshi krishna Guptha
╠²
This document discusses multiple linear regression analysis performed using SAS. It begins by outlining the assumptions of linear regression, including a linear relationship between variables, normality, no multicollinearity, and homoscedasticity. It then explains that multiple linear regression attempts to model the relationship between multiple explanatory variables and a response variable by fitting a linear equation to observed data. The document goes on to describe the regression analysis process, model selection, interpretation of outputs like R-squared and p-values, and evaluation of diagnostics like autocorrelation. It concludes by listing the predictor variables selected by the stepwise regression model and interpreting their parameter estimates.Regression analysis complete notes along with exampls
Regression analysis complete notes along with examplsS Gayu
╠²
The document covers regression analysis, explaining both simple and multiple linear regression, including key concepts like dependent and independent variables, correlation coefficients, and various statistical assumptions. It provides examples of regression equations and interpretation of model outputs, showcasing the significance of predictor variables and testing assumptions for normality, linearity, and homoscedasticity. Additionally, it discusses detecting outliers, high leverage points, and influential values using various metrics and plots.Quantitative Methods - Level II - CFA Program
Quantitative Methods - Level II - CFA ProgramMohamed Farouk, CFA, CFTe I
╠²
This document discusses correlation, regression, and issues that can arise when performing regression analysis. It defines correlation and covariance, and how to interpret a scatter plot. It explains how to test for statistical significance of correlation and establish if a linear relationship exists between variables. Simple and multiple linear regression are explained, including assumptions, model construction, and importance of regression coefficients. It discusses how to assess the importance of independent variables in explaining the dependent variable using t-tests, F-tests, R-squared, and adjusted R-squared. Potential issues like heteroskedasticity and multicollinearity are also summarized.linear regression PDF.pdf
linear regression PDF.pdfJoshuaLau29
╠²
1. A multiple regression analysis was conducted to predict problems related to drug use from self-efficacy, marijuana use, self-control, peer norms, and two dummy coded variables for race while controlling for other variables. The regression model accounted for 14% of the variance in drug problems.
2. Marijuana use and self-efficacy significantly predicted drug problems, with more marijuana use and lower self-efficacy associated with greater problems. Assumption checks found no significant violations.
3. A stepwise regression selected a two-predictor model with marijuana use and self-efficacy as significant predictors of drug problems.Statistical analysis in SPSS_
Statistical analysis in SPSS_ Dr. Anugamini Priya
╠²
This document discusses statistical analysis techniques such as descriptive analysis, reliability testing, correlation, and regression analysis. It provides details on calculating mean, standard deviation, Cronbach's alpha, Pearson's correlation coefficient, and using regression to analyze relationships between variables and test for mediation. Mediation is tested using Baron and Kenny's four step approach to determine if a third variable mediates the relationship between an independent and dependent variable.Statistical Treatment ....- Webinar.pptx
Statistical Treatment ....- Webinar.pptxEugeneBahia3
╠²
The document covers statistical treatments in quantitative research, detailing methods such as descriptive and inferential statistics, including t-tests, ANOVA, and Pearson's correlation. It discusses the evaluation of academic achievement in English and mathematics through various methods, emphasizing the significance of correlations between variables. Additionally, it explains the steps to calculate and interpret the Pearson correlation coefficient in the context of research studies.Correlation analysis in Biostatistics .pptx
Correlation analysis in Biostatistics .pptxHamdiMichaelCC
╠²
Correlation analysis measures the strength and direction of association between two variables. There are different types of correlation including simple, multiple, and partial correlation. Scatter diagrams and correlation coefficients like Pearson's r and Spearman's rho are common methods to study correlation. Pearson's r assumes a linear relationship between variables while Spearman's rho can be used when variables are ranked. A correlation coefficient close to 1 or -1 indicates a strong correlation while a value near 0 suggests no correlation.Regression_JAMOVI.pptx- Statistical data analysis
Regression_JAMOVI.pptx- Statistical data analysisdivya1313
╠²
The document provides a comprehensive overview of regression analysis, including definitions of dependent and independent variables, and details on simple and multiple linear regression models. It discusses the statistical assumptions necessary for ordinary least squares (OLS) regression, the interpretation of regression coefficients, and methods for checking model assumptions like linearity, normality, and homoscedasticity. Additionally, it outlines how to identify outliers, high leverage points, and influential values in regression analysis.Recep maz msb 701 quantitative analysis for managers
Recep maz msb 701 quantitative analysis for managersrecepmaz
╠²
Regression analysis is a statistical method used to understand the relationship between variables. It allows one to predict the value of a dependent variable based on the value of one or more independent variables. The summary examines a regression model with the total number of white people ages 18-64 as the dependent variable and the number of white people below the poverty level ages 18-64 as the independent variable. The regression outputs, including the R-squared, adjusted R-squared, significance F, and p-values are interpreted to evaluate the model and relationship between the variables. The analysis finds there is no significant relationship between the two variables in the model.Recep maz msb 701 quantitative analysis for managers
Recep maz msb 701 quantitative analysis for managersrecepmaz
╠²
Regression analysis is a statistical method used to understand the relationship between variables. It allows one to predict the value of a dependent variable based on the value of one or more independent variables. The summary examines a regression model with the total number of white people ages 18-64 as the dependent variable and the number of white people below the poverty level ages 18-64 as the independent variable. The regression outputs, including the R-squared, adjusted R-squared, significance F, and p-values are interpreted to evaluate the model and relationship between the variables. The analysis finds there is no significant relationship between the two variables in the model.Regression
RegressionSauravurp
╠²
This document discusses linear regression analysis. It defines simple and multiple linear regression, and explains that regression examines the relationship between independent and dependent variables. The document provides the equations for linear regression analysis, and discusses calculating the slope, intercept, standard error of the estimate, and coefficient of determination. It explains that regression analysis is widely used for prediction and forecasting in areas like advertising and product sales.ders 8 Quantile-Regression.ppt
ders 8 Quantile-Regression.pptErgin Akalpler
╠²
Quantile regression is an extension of linear regression that relates specific quantiles (percentiles) of the target variable to the predictor variables rather than just the mean. It makes fewer assumptions than ordinary least squares regression about the distribution of the target variable and is more robust to outliers. Quantile regression can provide a more complete picture of the relationship between variables by examining how predictors influence different parts of the conditional distribution.Correlational Research.pptx Correlational Research.pptx
Correlational Research.pptx Correlational Research.pptxMarieTaylaran1
╠²
The document discusses correlational research, explaining its non-experimental nature and how it assesses relationships between two variables without extraneous influences. It details the use of Pearson correlation in SPSS, interpretation of outputs, and differences between linear and multiple regression analyses, emphasizing their applications for predicting outcomes and understanding variable relationships. Additionally, it provides examples and guidelines for reporting statistical data effectively.5.-SIMPLE-LINEAR-REGRESSION-MEASURES-OF-CORRELATION.pptx
5.-SIMPLE-LINEAR-REGRESSION-MEASURES-OF-CORRELATION.pptxAnnMichelleJolo
╠²
This document discusses simple linear regression and measures of correlation. It defines simple linear regression as using a scatter plot and least squares method to find the line of best fit between two variables. It also discusses the standard error of estimate. Measures of correlation covered include the Pearson product-moment correlation coefficient, Spearman's rank correlation coefficient, gamma, and lambda. These measure the strength and direction of association between two variables.Ad
Recently uploaded (20)
Exploring Ocean Floor Features for Middle School
Exploring Ocean Floor Features for Middle SchoolMarie
╠²
This 16 slide science reader is all about ocean floor features. It was made to use with middle school students.
You can download the PDF at thehomeschooldaily.com
Thanks! Marie Chalukyas of Gujrat, Solanki Dynasty NEP.pptx
Chalukyas of Gujrat, Solanki Dynasty NEP.pptxDr. Ravi Shankar Arya Mahila P. G. College, Banaras Hindu University, Varanasi, India.
╠²
This presentation has been made keeping in mind the students of undergraduate and postgraduate level. In this slide try to present the brief history of Chaulukyas of Gujrat up to Kumarpala To keep the facts in a natural form and to display the material in more detail, the help of various books, websites and online medium has been taken. Whatever medium the material or facts have been taken from, an attempt has been made by the presenter to give their reference at the end.
Chaulukya or Solanki was one of the Rajputs born from Agnikul. In the Vadnagar inscription, the origin of this dynasty is told from Brahma's Chauluk or Kamandalu. They ruled in Gujarat from the latter half of the tenth century to the beginning of the thirteenth century. Their capital was in Anahilwad. It is not certain whether it had any relation with the Chalukya dynasty of the south or not. It is worth mentioning that the name of the dynasty of the south was 'Chaluky' while the dynasty of Gujarat has been called 'Chaulukya'. The rulers of this dynasty were the supporters and patrons of Jainism.GEOGRAPHY-Study Material [ Class 10th] .pdf
GEOGRAPHY-Study Material [ Class 10th] .pdfSHERAZ AHMAD LONE
╠²
"Geography Study Material for Class 10th" provides a comprehensive and easy-to-understand resource for key topics like Resources & Development, Water Resources, Agriculture, Minerals & Energy, Manufacturing Industries, and Lifelines of the National Economy. Designed as per the latest NCERT/JKBOSE syllabus, it includes notes, maps, diagrams, and MODEL question Paper to help students excel in exams. Whether revising for exams or strengthening conceptual clarity, this material ensures effective learning and high scores. Perfect for last-minute revisions and structured study sessions.june 10 2025 ppt for madden on art science is over.pptx
june 10 2025 ppt for madden on art science is over.pptxroger malina
╠²
art science is over -talk by roger malina for jack madden groupOverview of Employee in Odoo 18 - Odoo ║▌║▌▀Żs
Overview of Employee in Odoo 18 - Odoo ║▌║▌▀ŻsCeline George
╠²
The employee module is a core component of the HR workspace that helps the business to get the employee activities and details. This would also allow you to get the employee details by acting as a centralized system and accessing, updating, and managing all the other employee data. How to Create an Event in Odoo 18 - Odoo 18 ║▌║▌▀Żs
How to Create an Event in Odoo 18 - Odoo 18 ║▌║▌▀ŻsCeline George
╠²
Creating an event in Odoo 18 is a straightforward process that allows you to manage various aspects of your event efficiently.
Odoo 18 Events Module is a powerful tool for organizing and managing events of all sizes, from conferences and workshops to webinars and meetups. Plate Tectonic Boundaries and Continental Drift Theory
Plate Tectonic Boundaries and Continental Drift TheoryMarie
╠²
This 28 slide presentation covers the basics of plate tectonics and continental drift theory. It is an effective introduction into a full plate tectonics unit study, but does not cover faults, stress, seismic waves, or seafloor spreading.
To download PDF, visit The Homeschool Daily. We will be uploading more slideshows to follow this one. Blessings, Marie Capitol Doctoral Presentation -June 2025.pptx
Capitol Doctoral Presentation -June 2025.pptxCapitolTechU
╠²
║▌║▌▀Żs from a Capitol Technology University presentation covering doctoral programs offered by the university. All programs are online, and regionally accredited. The presentation covers degree program details, tuition, financial aid and the application process.Non-Communicable Diseases and National Health Programs ŌĆō Unit 10 | B.Sc Nursi...
Non-Communicable Diseases and National Health Programs ŌĆō Unit 10 | B.Sc Nursi...RAKESH SAJJAN
╠²
This PowerPoint presentation is prepared for Unit 10 ŌĆō Non-Communicable Diseases and National Health Programs, as per the 5th Semester B.Sc Nursing syllabus outlined by the Indian Nursing Council (INC) under the subject Community Health Nursing ŌĆō I.
This unit focuses on equipping students with knowledge of the causes, prevention, and control of non-communicable diseases (NCDs), which are a major public health challenge in India. The presentation emphasizes the nurseŌĆÖs role in early detection, screening, management, and referral services under national-level programs.
¤ö╣ Key Topics Included:
Definition, burden, and impact of NCDs in India
Epidemiology, risk factors, signs/symptoms, prevention, and management of:
Diabetes Mellitus
Hypertension
Cardiovascular Diseases
Stroke & Obesity
Thyroid Disorders
Blindness
Deafness
Injuries and Accidents (incl. road traffic injuries and trauma guidelines)
NCD-2 Cancers:
Breast Cancer
Cervical Cancer
Oral Cancer
Risk factors, screening, diagnosis, early signs, referral & palliative care
Role of nurse in screening, referral, counseling, and continuum of care
National Programs:
National Program for Prevention and Control of Cancer, Diabetes, Cardiovascular Diseases and Stroke (NPCDCS)
National Program for Control of Blindness
National Program for Prevention and Control of Deafness
National Tobacco Control Program (NTCP)
Introduction to Universal Health Coverage and Ayushman Bharat
Use of standard treatment protocols and referral flowcharts
This presentation is ideal for:
Classroom lectures, field assignments, health education planning, and student projects
Preparing for university exams, class tests, and community field postingsSustainable Innovation with Immersive Learning
Sustainable Innovation with Immersive LearningLeonel Morgado
╠²
Prof. Leonel and Prof. Dennis approached educational uses, practices, and strategies of using immersion as a lens to interpret, design, and planning educational activities in a sustainable way. Rather than one-off gimmicks, the intent is to enable instructors (and institutions) to be able to include them in their regular activities, including the ability to evaluate and redesign them.
Immersion as a phenomenon enables interpreting pedagogical activities in a learning-agnostic way: you take a stance on the learning theory to follow, and leverage immersion to envision and guide your practice.THERAPEUTIC COMMUNICATION included definition, characteristics, nurse patient...
THERAPEUTIC COMMUNICATION included definition, characteristics, nurse patient...parmarjuli1412
╠²
The document provides an overview of therapeutic communication, emphasizing its importance in nursing to address patient needs and establish effective relationships. THERAPEUTIC COMMUNICATION included some topics like introduction of COMMUNICATION, definition, types, process of communication, definition therapeutic communication, goal, techniques of therapeutic communication, non-therapeutic communication, few ways to improved therapeutic communication, characteristics of therapeutic communication, barrier of THERAPEUTIC RELATIONSHIP, introduction of interpersonal relationship, types of IPR, elements/ dynamics of IPR, introduction of therapeutic nurse patient relationship, definition, purpose, elements/characteristics , and phases of therapeutic communication, definition of Johari window, uses, what actually model represent and its areas, THERAPEUTIC IMPASSES and its management in 5th semester Bsc. nursing and 2nd GNM studentsMeasuring, learning and applying multiplication facts.
Measuring, learning and applying multiplication facts.cgilmore6
╠²
║▌║▌▀Żs from a presentation by Professor Camilla Gilmore to the Association of Teachers of Mathematics and Mathematics Association Primary Interest group in June 2025.
This gave an overview of two studies that investigated children's multiplication fact knowledge. These studies were part of the SUM research project based at the University of Nottingham and Loughborough University. For more information see www.sumproject.org.ukBattle of Bookworms 2025 - U25 Literature Quiz by Pragya
Battle of Bookworms 2025 - U25 Literature Quiz by Pragya Pragya - UEM Kolkata Quiz Club
╠²
Battle of Bookworms is a literature quiz organized by Pragya, UEM Kolkata, as part of their cultural fest Ecstasia. Curated by quizmasters Drisana Bhattacharyya, Argha Saha, and Aniket Adhikari, the quiz was a dynamic mix of classical literature, modern writing, mythology, regional texts, and experimental literary forms. It began with a 20-question prelim round where ŌĆśstar questionsŌĆÖ played a key tie-breaking role. The top 8 teams moved into advanced rounds, where they faced audio-visual challenges, pounce/bounce formats, immunity tokens, and theme-based risk-reward questions. From Orwell and Hemingway to Tagore and Sarala Das, the quiz traversed a global and Indian literary landscape. Unique rounds explored slipstream fiction, constrained writing, adaptations, and true crime literature. It included signature IDs, character identifications, and open-pounce selections. Questions were crafted to test contextual understanding, narrative knowledge, and authorial intent, making the quiz both intellectually rewarding and culturally rich. Battle of Bookworms proved literature quizzes can be insightful, creative, and deeply enjoyable for all.Paper 108 | ThoreauŌĆÖs Influence on Gandhi: The Evolution of Civil Disobedience
Paper 108 | ThoreauŌĆÖs Influence on Gandhi: The Evolution of Civil DisobedienceRajdeep Bavaliya
╠²
Dive into the powerful journey from ThoreauŌĆÖs 19thŌĆæcentury essay to GandhiŌĆÖs mass movement, and discover how one manŌĆÖs moral stand became the backbone of nonviolent resistance worldwide. Learn how conscience met strategy to spark revolutions, and why their legacy still inspires todayŌĆÖs social justice warriors. Uncover the evolution of civil disobedience. DonŌĆÖt forget to like, share, and follow for more deep dives into the ideas that changed the world.
M.A. Sem - 2 | Presentation
Presentation Season - 2
Paper - 108: The American Literature
Submitted Date: April 2, 2025
Paper Name: The American Literature
Topic: ThoreauŌĆÖs Influence on Gandhi: The Evolution of Civil Disobedience
[Please copy the link and paste it into any web browser to access the content.]
Video Link: https://youtu.be/HXeq6utg7iQ
For a more in-depth discussion of this presentation, please visit the full blog post at the following link: https://rajdeepbavaliya2.blogspot.com/2025/04/thoreau-s-influence-on-gandhi-the-evolution-of-civil-disobedience.html
Please visit this blog to explore additional presentations from this season:
Hashtags:
#CivilDisobedience #ThoreauToGandhi #NonviolentResistance #Satyagraha #Transcendentalism #SocialJustice #HistoryUncovered #GandhiLegacy #ThoreauInfluence #PeacefulProtest
Keyword Tags:
civil disobedience, Thoreau, Gandhi, Satyagraha, nonviolent protest, transcendentalism, moral resistance, Gandhi Thoreau connection, social change, political philosophyHow to Configure Vendor Management in Lunch App of Odoo 18
How to Configure Vendor Management in Lunch App of Odoo 18Celine George
╠²
The Vendor management in the Lunch app of Odoo 18 is the central hub for managing all aspects of the restaurants or caterers that provide food for your employees. Chalukyas of Gujrat, Solanki Dynasty NEP.pptx
Chalukyas of Gujrat, Solanki Dynasty NEP.pptxDr. Ravi Shankar Arya Mahila P. G. College, Banaras Hindu University, Varanasi, India.
╠²
Ad
Correlation & Linear Regression
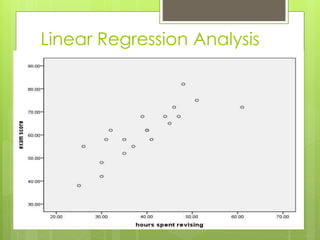
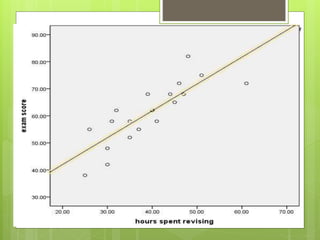
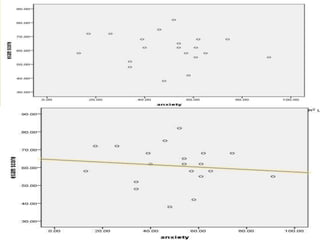
- 1. NYC Charter School Performance on the 2012-13 State Exams 1. Bivariate Correlations 2. Linear Regression Analysis 3. Multiple Regression Analysis
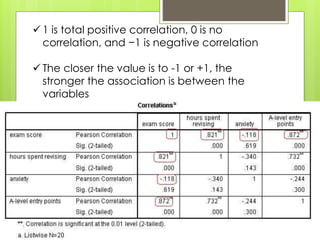
- 2. Bivariate Correlations ’éø Bivariate Correlation ’éø Paersone Correlation or Co-efficient of correlation ’éø Scale level of measurement
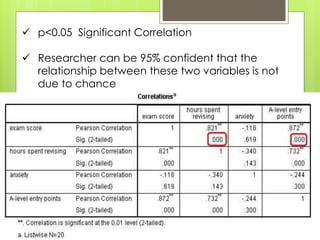
- 3. ’ā╝ p<0.05 Significant Correlation ’ā╝ Researcher can be 95% confident that the relationship between these two variables is not due to chance
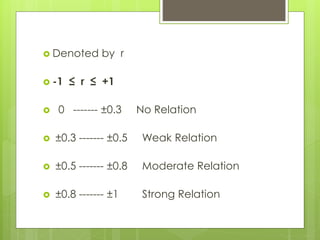
- 4. ’éø Denoted ’éø -1 by r Ōēż r Ōēż +1 ’éø 0 ------- ┬▒0.3 No Relation ’éø ┬▒0.3 ------- ┬▒0.5 Weak Relation ’éø ┬▒0.5 ------- ┬▒0.8 Moderate Relation ’éø ┬▒0.8 ------- ┬▒1 Strong Relation
- 5. ’ā╝ 1 is total positive correlation, 0 is no correlation, and ŌłÆ1 is negative correlation ’ā╝ The closer the value is to -1 or +1, the stronger the association is between the variables
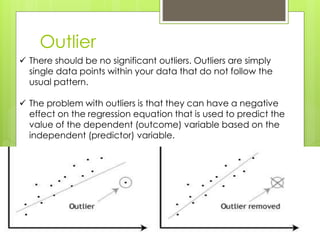
- 9. Outlier ’ā╝ There should be no significant outliers. Outliers are simply single data points within your data that do not follow the usual pattern. ’ā╝ The problem with outliers is that they can have a negative effect on the regression equation that is used to predict the value of the dependent (outcome) variable based on the independent (predictor) variable.
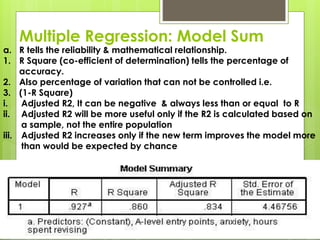
- 10. Multiple Regression: Model Sum a. R tells the reliability & mathematical relationship. 1. R Square (co-efficient of determination) tells the percentage of accuracy. 2. Also percentage of variation that can not be controlled i.e. 3. (1-R Square) i. Adjusted R2, It can be negative & always less than or equal to R ii. Adjusted R2 will be more useful only if the R2 is calculated based on a sample, not the entire population iii. Adjusted R2 increases only if the new term improves the model more than would be expected by chance
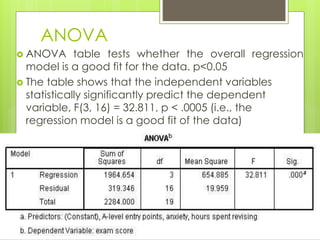
- 11. ANOVA ’éø ANOVA table tests whether the overall regression model is a good fit for the data. p<0.05 ’éø The table shows that the independent variables statistically significantly predict the dependent variable, F(3, 16) = 32.811, p < .0005 (i.e., the regression model is a good fit of the data)
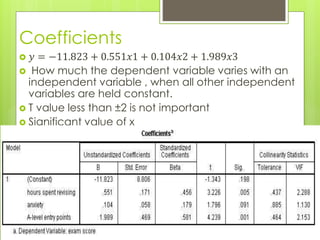
- 12. Coefficients Øæ” = ŌłÆ11.823 + 0.551Øæź1 + 0.104Øæź2 + 1.989Øæź3 ’éø How much the dependent variable varies with an independent variable , when all other independent variables are held constant. ’éø T value less than ┬▒2 is not important ’éø Significant value of x ’éø