ºÝºÝߣ

ºÝºÝߣShare a Scribd company logo
COVID-19 Dashboards created with BI-tools
Microsoft Power BI, Google Data Studio and Tableau
By: Maarten van Reek
mvanreek@gmail
linkedin.com/in/mvanreek
Blog:
https://worktimesheet2014.blogspot.com
Data-viz. project: 1: get data, 2: transform data, 3: visualize data
Microsoft Power BI report 1: Esri ArcGIS map
Blog-post
Microsoft Power BI report 2: Esri ArcGIS animated map
Blog-post Video
Microsoft Power BI report 3: shape-map
+ time-series for 3 main indicators , mobile design
Blog-post
AI in Power BI: Natural Language Query + Quick Insights
More examples of AI in
Power BI e.g. explain
increase/decrease in
timeseries
Microsoft Power BI report 4: timeseries 3 countries
Blog-post
Microsoft Power BI report 5:
time- and location view in NL
Blog-post
Tableau report: provinces,
cities (municipalities)
Blog-post
Google Data Studio report: map and
time-series for 3 main indicators
Blog-post
Google Analytics for my blog, since start
pandemic in NL (1/2)
Google Analytics for my blog, since start
pandemic in NL (2/2)
#AndraTuttoBene / #TodoIráBien (it will be OK!)
.. and science and IT are an important part of the solution!
CoronaWatchNL, open COVID-19 Data of Netherlands, winner of RDNL Dutch Data Prize
COVID-19 European data on Harvard Dataverse
CoronaWhy – international group of volunteers using AI to track COVID-19
Video with some Esri ArcGIS examples of the world’s COVID-19 response

More Related Content

Similar to Covid-19 dashboards created with Microsoft Power BI (20)

Power BI Online Training hyderabad | Power BI online Course
Power BI Online Training hyderabad   | Power BI online Course Power BI Online Training hyderabad   | Power BI online Course
Power BI Online Training hyderabad | Power BI online Course
Cynix Technologies
Ìý
Power bi
Power biPower bi
Power bi
Lakshmi Prasanna Kottagorla
Ìý
Build Interactive Analytics using Power BI
Build Interactive Analytics using Power BIBuild Interactive Analytics using Power BI
Build Interactive Analytics using Power BI
Mostafa
Ìý
Ordina SOFTC Presentation - UsingGeoData_ReportBuilder
Ordina SOFTC Presentation - UsingGeoData_ReportBuilderOrdina SOFTC Presentation - UsingGeoData_ReportBuilder
Ordina SOFTC Presentation - UsingGeoData_ReportBuilder
Ordina Belgium
Ìý
Power bi (1)Power BI Online Training Hyderabad | power bi online training ben...
Power bi (1)Power BI Online Training Hyderabad | power bi online training ben...Power bi (1)Power BI Online Training Hyderabad | power bi online training ben...
Power bi (1)Power BI Online Training Hyderabad | power bi online training ben...
Big IT Trainings
Ìý
Building the BI system and analytics capabilities at the company based on Rea...
Building the BI system and analytics capabilities at the company based on Rea...Building the BI system and analytics capabilities at the company based on Rea...
Building the BI system and analytics capabilities at the company based on Rea...
GameCamp
Ìý
°ä³Õ³å´³²¹¾±³¾±ð³§²¹²Ô³Ù´Ç²õ³Ò´Ç²Ô³úá±ô±ð³ú³å20250107³å1524³å·¡²Ô²µ±ô¾±²õ³ó
°ä³Õ³å´³²¹¾±³¾±ð³§²¹²Ô³Ù´Ç²õ³Ò´Ç²Ô³úá±ô±ð³ú³å20250107³å1524³å·¡²Ô²µ±ô¾±²õ³ó°ä³Õ³å´³²¹¾±³¾±ð³§²¹²Ô³Ù´Ç²õ³Ò´Ç²Ô³úá±ô±ð³ú³å20250107³å1524³å·¡²Ô²µ±ô¾±²õ³ó
°ä³Õ³å´³²¹¾±³¾±ð³§²¹²Ô³Ù´Ç²õ³Ò´Ç²Ô³úá±ô±ð³ú³å20250107³å1524³å·¡²Ô²µ±ô¾±²õ³ó
Jaime Santos Gonzalez
Ìý
Anshul bhatt profile jasper
Anshul bhatt profile  jasperAnshul bhatt profile  jasper
Anshul bhatt profile jasper
Anshul Bhatt
Ìý
Let's add Power BI to your IT-Systems or Apps
Let's add Power BI to your IT-Systems or AppsLet's add Power BI to your IT-Systems or Apps
Let's add Power BI to your IT-Systems or Apps
Yugo Shimizu
Ìý
Quo vadis Power BI?
Quo vadis Power BI?Quo vadis Power BI?
Quo vadis Power BI?
Trivadis
Ìý
Analyzing and visualizing data with power bi edukite
Analyzing and visualizing data with power bi   edukiteAnalyzing and visualizing data with power bi   edukite
Analyzing and visualizing data with power bi edukite
EduKite
Ìý
How to Export Power BI Dashboards using Power Automate in 7 Steps
How to Export Power BI Dashboards using Power Automate in 7 StepsHow to Export Power BI Dashboards using Power Automate in 7 Steps
How to Export Power BI Dashboards using Power Automate in 7 Steps
Kavika Roy
Ìý
Cherokee nation 2 day AIAD & DIAD - App in a day and Dashboard in day
Cherokee nation 2 day AIAD & DIAD - App in a day and Dashboard in dayCherokee nation 2 day AIAD & DIAD - App in a day and Dashboard in day
Cherokee nation 2 day AIAD & DIAD - App in a day and Dashboard in day
Vishal Pawar
Ìý
INTRODUCTION TO MICROSOFT POWER BI.pdf
INTRODUCTION TO MICROSOFT POWER BI.pdfINTRODUCTION TO MICROSOFT POWER BI.pdf
INTRODUCTION TO MICROSOFT POWER BI.pdf
ssusera4419c
Ìý
Resume
ResumeResume
Resume
Hitesh Natha Laware
Ìý
Introducing Power BI Embedded
Introducing Power BI EmbeddedIntroducing Power BI Embedded
Introducing Power BI Embedded
Mostafa
Ìý
Create bar chart report for p6 r8.3 using bi publisher 11g - Oracle Primavera...
Create bar chart report for p6 r8.3 using bi publisher 11g - Oracle Primavera...Create bar chart report for p6 r8.3 using bi publisher 11g - Oracle Primavera...
Create bar chart report for p6 r8.3 using bi publisher 11g - Oracle Primavera...
p6academy
Ìý
Sql Sat 519_reporting_services_2016
Sql Sat 519_reporting_services_2016Sql Sat 519_reporting_services_2016
Sql Sat 519_reporting_services_2016
Andrea Martorana Tusa
Ìý
O365Engage17 - How to use google analytics with power bi
O365Engage17 - How to use google analytics with power bi O365Engage17 - How to use google analytics with power bi
O365Engage17 - How to use google analytics with power bi
NCCOMMS
Ìý
Microsoft power bi training courses
Microsoft power bi training coursesMicrosoft power bi training courses
Microsoft power bi training courses
katozesiro
Ìý
Power BI Online Training hyderabad | Power BI online Course
Power BI Online Training hyderabad   | Power BI online Course Power BI Online Training hyderabad   | Power BI online Course
Power BI Online Training hyderabad | Power BI online Course
Cynix Technologies
Ìý
Build Interactive Analytics using Power BI
Build Interactive Analytics using Power BIBuild Interactive Analytics using Power BI
Build Interactive Analytics using Power BI
Mostafa
Ìý
Ordina SOFTC Presentation - UsingGeoData_ReportBuilder
Ordina SOFTC Presentation - UsingGeoData_ReportBuilderOrdina SOFTC Presentation - UsingGeoData_ReportBuilder
Ordina SOFTC Presentation - UsingGeoData_ReportBuilder
Ordina Belgium
Ìý
Power bi (1)Power BI Online Training Hyderabad | power bi online training ben...
Power bi (1)Power BI Online Training Hyderabad | power bi online training ben...Power bi (1)Power BI Online Training Hyderabad | power bi online training ben...
Power bi (1)Power BI Online Training Hyderabad | power bi online training ben...
Big IT Trainings
Ìý
Building the BI system and analytics capabilities at the company based on Rea...
Building the BI system and analytics capabilities at the company based on Rea...Building the BI system and analytics capabilities at the company based on Rea...
Building the BI system and analytics capabilities at the company based on Rea...
GameCamp
Ìý
°ä³Õ³å´³²¹¾±³¾±ð³§²¹²Ô³Ù´Ç²õ³Ò´Ç²Ô³úá±ô±ð³ú³å20250107³å1524³å·¡²Ô²µ±ô¾±²õ³ó
°ä³Õ³å´³²¹¾±³¾±ð³§²¹²Ô³Ù´Ç²õ³Ò´Ç²Ô³úá±ô±ð³ú³å20250107³å1524³å·¡²Ô²µ±ô¾±²õ³ó°ä³Õ³å´³²¹¾±³¾±ð³§²¹²Ô³Ù´Ç²õ³Ò´Ç²Ô³úá±ô±ð³ú³å20250107³å1524³å·¡²Ô²µ±ô¾±²õ³ó
°ä³Õ³å´³²¹¾±³¾±ð³§²¹²Ô³Ù´Ç²õ³Ò´Ç²Ô³úá±ô±ð³ú³å20250107³å1524³å·¡²Ô²µ±ô¾±²õ³ó
Jaime Santos Gonzalez
Ìý
Anshul bhatt profile jasper
Anshul bhatt profile  jasperAnshul bhatt profile  jasper
Anshul bhatt profile jasper
Anshul Bhatt
Ìý
Let's add Power BI to your IT-Systems or Apps
Let's add Power BI to your IT-Systems or AppsLet's add Power BI to your IT-Systems or Apps
Let's add Power BI to your IT-Systems or Apps
Yugo Shimizu
Ìý
Quo vadis Power BI?
Quo vadis Power BI?Quo vadis Power BI?
Quo vadis Power BI?
Trivadis
Ìý
Analyzing and visualizing data with power bi edukite
Analyzing and visualizing data with power bi   edukiteAnalyzing and visualizing data with power bi   edukite
Analyzing and visualizing data with power bi edukite
EduKite
Ìý
How to Export Power BI Dashboards using Power Automate in 7 Steps
How to Export Power BI Dashboards using Power Automate in 7 StepsHow to Export Power BI Dashboards using Power Automate in 7 Steps
How to Export Power BI Dashboards using Power Automate in 7 Steps
Kavika Roy
Ìý
Cherokee nation 2 day AIAD & DIAD - App in a day and Dashboard in day
Cherokee nation 2 day AIAD & DIAD - App in a day and Dashboard in dayCherokee nation 2 day AIAD & DIAD - App in a day and Dashboard in day
Cherokee nation 2 day AIAD & DIAD - App in a day and Dashboard in day
Vishal Pawar
Ìý
INTRODUCTION TO MICROSOFT POWER BI.pdf
INTRODUCTION TO MICROSOFT POWER BI.pdfINTRODUCTION TO MICROSOFT POWER BI.pdf
INTRODUCTION TO MICROSOFT POWER BI.pdf
ssusera4419c
Ìý
Introducing Power BI Embedded
Introducing Power BI EmbeddedIntroducing Power BI Embedded
Introducing Power BI Embedded
Mostafa
Ìý
Create bar chart report for p6 r8.3 using bi publisher 11g - Oracle Primavera...
Create bar chart report for p6 r8.3 using bi publisher 11g - Oracle Primavera...Create bar chart report for p6 r8.3 using bi publisher 11g - Oracle Primavera...
Create bar chart report for p6 r8.3 using bi publisher 11g - Oracle Primavera...
p6academy
Ìý
Sql Sat 519_reporting_services_2016
Sql Sat 519_reporting_services_2016Sql Sat 519_reporting_services_2016
Sql Sat 519_reporting_services_2016
Andrea Martorana Tusa
Ìý
O365Engage17 - How to use google analytics with power bi
O365Engage17 - How to use google analytics with power bi O365Engage17 - How to use google analytics with power bi
O365Engage17 - How to use google analytics with power bi
NCCOMMS
Ìý
Microsoft power bi training courses
Microsoft power bi training coursesMicrosoft power bi training courses
Microsoft power bi training courses
katozesiro
Ìý

Recently uploaded (20)

PRGTUG Meeting: Lost in Data? Let's Chart the Way Out!
PRGTUG Meeting: Lost in Data? Let's Chart the Way Out!PRGTUG Meeting: Lost in Data? Let's Chart the Way Out!
PRGTUG Meeting: Lost in Data? Let's Chart the Way Out!
Stanislava Tropcheva
Ìý
Updated Willow 2025 Media Deck_270225.pdf
Updated Willow 2025 Media Deck_270225.pdfUpdated Willow 2025 Media Deck_270225.pdf
Updated Willow 2025 Media Deck_270225.pdf
tangramcommunication
Ìý
PRGTUG: Lost in Data? Let's Chart the Way Out!
PRGTUG: Lost in Data? Let's Chart the Way Out!PRGTUG: Lost in Data? Let's Chart the Way Out!
PRGTUG: Lost in Data? Let's Chart the Way Out!
Stanislava Tropcheva
Ìý
Updated Willow 2025 Media Deck_280225 Updated.pdf
Updated Willow 2025 Media Deck_280225 Updated.pdfUpdated Willow 2025 Media Deck_280225 Updated.pdf
Updated Willow 2025 Media Deck_280225 Updated.pdf
tangramcommunication
Ìý
Pink Yellow Purple Lifestyle Vision Board Scribbles Doodles Whiteboard Pres_2...
Pink Yellow Purple Lifestyle Vision Board Scribbles Doodles Whiteboard Pres_2...Pink Yellow Purple Lifestyle Vision Board Scribbles Doodles Whiteboard Pres_2...
Pink Yellow Purple Lifestyle Vision Board Scribbles Doodles Whiteboard Pres_2...
jarreldelacruz31
Ìý
Herding behavior Experimental Studies --AlisonLo
Herding behavior Experimental Studies --AlisonLoHerding behavior Experimental Studies --AlisonLo
Herding behavior Experimental Studies --AlisonLo
AlisonKL
Ìý
Design Data Model Objects for Analytics, Activation, and AI
Design Data Model Objects for Analytics, Activation, and AIDesign Data Model Objects for Analytics, Activation, and AI
Design Data Model Objects for Analytics, Activation, and AI
aaronmwinters
Ìý
Lesson 6- Data Visualization and Reporting.pptx
Lesson 6- Data Visualization and Reporting.pptxLesson 6- Data Visualization and Reporting.pptx
Lesson 6- Data Visualization and Reporting.pptx
1045858
Ìý
Large Language Models (LLMs) part one.pptx
Large Language Models (LLMs) part one.pptxLarge Language Models (LLMs) part one.pptx
Large Language Models (LLMs) part one.pptx
harmardir
Ìý
Data Privacy presentation for companies.pptx
Data Privacy presentation for companies.pptxData Privacy presentation for companies.pptx
Data Privacy presentation for companies.pptx
harmardir
Ìý
Certificado Business Intelligence - Alber Florentin.pdf
Certificado Business Intelligence - Alber Florentin.pdfCertificado Business Intelligence - Alber Florentin.pdf
Certificado Business Intelligence - Alber Florentin.pdf
alberalen
Ìý
When Models Meet Data: From ancient science to todays Artificial Intelligence...
When Models Meet Data: From ancient science to todays Artificial Intelligence...When Models Meet Data: From ancient science to todays Artificial Intelligence...
When Models Meet Data: From ancient science to todays Artificial Intelligence...
ssuserbbbef4
Ìý
Analyzing Consumer Spending Trends and Purchasing Behavior
Analyzing Consumer Spending Trends and Purchasing BehaviorAnalyzing Consumer Spending Trends and Purchasing Behavior
Analyzing Consumer Spending Trends and Purchasing Behavior
omololaokeowo1
Ìý
Plant Disease Prediction with Image Classification using CNN.pdf
Plant Disease Prediction with Image Classification using CNN.pdfPlant Disease Prediction with Image Classification using CNN.pdf
Plant Disease Prediction with Image Classification using CNN.pdf
Theekshana Wanniarachchi
Ìý
9th Edition of International Research Awards
9th Edition of International Research Awards9th Edition of International Research Awards
9th Edition of International Research Awards
sciencereviewerview
Ìý
Episode_10_-_The_Art_of_Rhetoric (1).pptx
Episode_10_-_The_Art_of_Rhetoric (1).pptxEpisode_10_-_The_Art_of_Rhetoric (1).pptx
Episode_10_-_The_Art_of_Rhetoric (1).pptx
addelynngue5115
Ìý
158646276-Monitoring-Exadata-Performance.pptx
158646276-Monitoring-Exadata-Performance.pptx158646276-Monitoring-Exadata-Performance.pptx
158646276-Monitoring-Exadata-Performance.pptx
Aditya Mishra
Ìý
Industry_Use_Cases.ppt Industry_Use_Cases.ppt
Industry_Use_Cases.ppt Industry_Use_Cases.pptIndustry_Use_Cases.ppt Industry_Use_Cases.ppt
Industry_Use_Cases.ppt Industry_Use_Cases.ppt
ssuser3e8ddb
Ìý
vnptloveeeeeeeeeeeeeeeeeeeeeeeeeeee.pptx
vnptloveeeeeeeeeeeeeeeeeeeeeeeeeeee.pptxvnptloveeeeeeeeeeeeeeeeeeeeeeeeeeee.pptx
vnptloveeeeeeeeeeeeeeeeeeeeeeeeeeee.pptx
deomom129
Ìý
Chapter 2 - Understanding Computer Investigations.ppt
Chapter 2 - Understanding Computer Investigations.pptChapter 2 - Understanding Computer Investigations.ppt
Chapter 2 - Understanding Computer Investigations.ppt
kong100
Ìý
PRGTUG Meeting: Lost in Data? Let's Chart the Way Out!
PRGTUG Meeting: Lost in Data? Let's Chart the Way Out!PRGTUG Meeting: Lost in Data? Let's Chart the Way Out!
PRGTUG Meeting: Lost in Data? Let's Chart the Way Out!
Stanislava Tropcheva
Ìý
Updated Willow 2025 Media Deck_270225.pdf
Updated Willow 2025 Media Deck_270225.pdfUpdated Willow 2025 Media Deck_270225.pdf
Updated Willow 2025 Media Deck_270225.pdf
tangramcommunication
Ìý
PRGTUG: Lost in Data? Let's Chart the Way Out!
PRGTUG: Lost in Data? Let's Chart the Way Out!PRGTUG: Lost in Data? Let's Chart the Way Out!
PRGTUG: Lost in Data? Let's Chart the Way Out!
Stanislava Tropcheva
Ìý
Updated Willow 2025 Media Deck_280225 Updated.pdf
Updated Willow 2025 Media Deck_280225 Updated.pdfUpdated Willow 2025 Media Deck_280225 Updated.pdf
Updated Willow 2025 Media Deck_280225 Updated.pdf
tangramcommunication
Ìý
Pink Yellow Purple Lifestyle Vision Board Scribbles Doodles Whiteboard Pres_2...
Pink Yellow Purple Lifestyle Vision Board Scribbles Doodles Whiteboard Pres_2...Pink Yellow Purple Lifestyle Vision Board Scribbles Doodles Whiteboard Pres_2...
Pink Yellow Purple Lifestyle Vision Board Scribbles Doodles Whiteboard Pres_2...
jarreldelacruz31
Ìý
Herding behavior Experimental Studies --AlisonLo
Herding behavior Experimental Studies --AlisonLoHerding behavior Experimental Studies --AlisonLo
Herding behavior Experimental Studies --AlisonLo
AlisonKL
Ìý
Design Data Model Objects for Analytics, Activation, and AI
Design Data Model Objects for Analytics, Activation, and AIDesign Data Model Objects for Analytics, Activation, and AI
Design Data Model Objects for Analytics, Activation, and AI
aaronmwinters
Ìý
Lesson 6- Data Visualization and Reporting.pptx
Lesson 6- Data Visualization and Reporting.pptxLesson 6- Data Visualization and Reporting.pptx
Lesson 6- Data Visualization and Reporting.pptx
1045858
Ìý
Large Language Models (LLMs) part one.pptx
Large Language Models (LLMs) part one.pptxLarge Language Models (LLMs) part one.pptx
Large Language Models (LLMs) part one.pptx
harmardir
Ìý
Data Privacy presentation for companies.pptx
Data Privacy presentation for companies.pptxData Privacy presentation for companies.pptx
Data Privacy presentation for companies.pptx
harmardir
Ìý
Certificado Business Intelligence - Alber Florentin.pdf
Certificado Business Intelligence - Alber Florentin.pdfCertificado Business Intelligence - Alber Florentin.pdf
Certificado Business Intelligence - Alber Florentin.pdf
alberalen
Ìý
When Models Meet Data: From ancient science to todays Artificial Intelligence...
When Models Meet Data: From ancient science to todays Artificial Intelligence...When Models Meet Data: From ancient science to todays Artificial Intelligence...
When Models Meet Data: From ancient science to todays Artificial Intelligence...
ssuserbbbef4
Ìý
Analyzing Consumer Spending Trends and Purchasing Behavior
Analyzing Consumer Spending Trends and Purchasing BehaviorAnalyzing Consumer Spending Trends and Purchasing Behavior
Analyzing Consumer Spending Trends and Purchasing Behavior
omololaokeowo1
Ìý
Plant Disease Prediction with Image Classification using CNN.pdf
Plant Disease Prediction with Image Classification using CNN.pdfPlant Disease Prediction with Image Classification using CNN.pdf
Plant Disease Prediction with Image Classification using CNN.pdf
Theekshana Wanniarachchi
Ìý
9th Edition of International Research Awards
9th Edition of International Research Awards9th Edition of International Research Awards
9th Edition of International Research Awards
sciencereviewerview
Ìý
Episode_10_-_The_Art_of_Rhetoric (1).pptx
Episode_10_-_The_Art_of_Rhetoric (1).pptxEpisode_10_-_The_Art_of_Rhetoric (1).pptx
Episode_10_-_The_Art_of_Rhetoric (1).pptx
addelynngue5115
Ìý
158646276-Monitoring-Exadata-Performance.pptx
158646276-Monitoring-Exadata-Performance.pptx158646276-Monitoring-Exadata-Performance.pptx
158646276-Monitoring-Exadata-Performance.pptx
Aditya Mishra
Ìý
Industry_Use_Cases.ppt Industry_Use_Cases.ppt
Industry_Use_Cases.ppt Industry_Use_Cases.pptIndustry_Use_Cases.ppt Industry_Use_Cases.ppt
Industry_Use_Cases.ppt Industry_Use_Cases.ppt
ssuser3e8ddb
Ìý
vnptloveeeeeeeeeeeeeeeeeeeeeeeeeeee.pptx
vnptloveeeeeeeeeeeeeeeeeeeeeeeeeeee.pptxvnptloveeeeeeeeeeeeeeeeeeeeeeeeeeee.pptx
vnptloveeeeeeeeeeeeeeeeeeeeeeeeeeee.pptx
deomom129
Ìý
Chapter 2 - Understanding Computer Investigations.ppt
Chapter 2 - Understanding Computer Investigations.pptChapter 2 - Understanding Computer Investigations.ppt
Chapter 2 - Understanding Computer Investigations.ppt
kong100
Ìý

Covid-19 dashboards created with Microsoft Power BI

  • 1. COVID-19 Dashboards created with BI-tools Microsoft Power BI, Google Data Studio and Tableau By: Maarten van Reek mvanreek@gmail linkedin.com/in/mvanreek Blog: https://worktimesheet2014.blogspot.com
  • 2. Data-viz. project: 1: get data, 2: transform data, 3: visualize data
  • 3. Microsoft Power BI report 1: Esri ArcGIS map Blog-post
  • 4. Microsoft Power BI report 2: Esri ArcGIS animated map Blog-post Video
  • 5. Microsoft Power BI report 3: shape-map + time-series for 3 main indicators , mobile design Blog-post
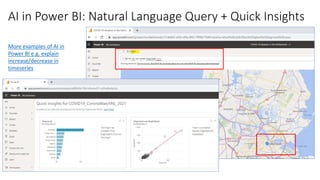
  • 6. AI in Power BI: Natural Language Query + Quick Insights More examples of AI in Power BI e.g. explain increase/decrease in timeseries
  • 7. Microsoft Power BI report 4: timeseries 3 countries Blog-post
  • 8. Microsoft Power BI report 5: time- and location view in NL Blog-post
  • 9. Tableau report: provinces, cities (municipalities) Blog-post
  • 10. Google Data Studio report: map and time-series for 3 main indicators Blog-post
  • 11. Google Analytics for my blog, since start pandemic in NL (1/2)
  • 12. Google Analytics for my blog, since start pandemic in NL (2/2)
  • 13. #AndraTuttoBene / #TodoIráBien (it will be OK!) .. and science and IT are an important part of the solution! CoronaWatchNL, open COVID-19 Data of Netherlands, winner of RDNL Dutch Data Prize COVID-19 European data on Harvard Dataverse CoronaWhy – international group of volunteers using AI to track COVID-19 Video with some Esri ArcGIS examples of the world’s COVID-19 response