cpm bar chART.docx
Download as DOCX, PDF0 likes6 views
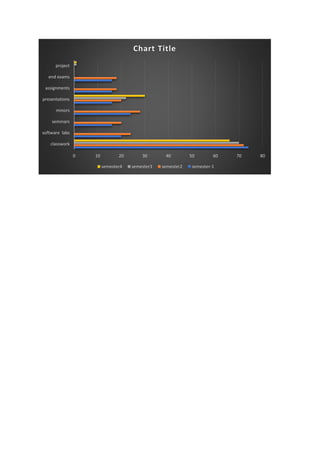
The document appears to be a chart showing the distribution of various academic activities across four semesters of study. It lists classwork, labs, seminars, minors, presentations, assignments, exams, and projects on the y-axis and semesters 4 through 1 on the x-axis, suggesting this chart tracks the workload or emphasis of different components of a university program over the course of four years of study.
1 of 1
Download to read offline
Recommended
template-1.pptx
template-1.pptxMansimishra351962
Ėý
Life Cycle Assessment (LCA) is a standardized method to track and report the environmental impacts of a product or process throughout its full life cycle. An LCA for construction includes four phases: goal and scope definition, inventory analysis, impact assessment, and interpretation. The goal and scope define the study parameters. Inventory analysis collects and calculates input/output data. Impact assessment relates emissions to environmental/health impacts. Interpretation critically evaluates strengths/weaknesses and identifies significant issues to draw conclusions. LCA provides a comprehensive way to understand and improve a building's environmental performance from cradle to grave.Seminar Underground Construction PPT.pptx
Seminar Underground Construction PPT.pptxMansimishra351962
Ėý
The document discusses underground construction and tunneling techniques. It describes various tunnel shapes and factors to consider in tunnel construction like collapse prevention, ventilation, precision, and safety. Common tunneling methods include the tunnel boring machine (TBM) method, conventional drilling and blasting, and the tunneling shield method. Case studies of the Gotthard Base Tunnel and Bolu Tunnel are provided, along with conclusions on utilizing different construction methods and developing new technologies for small-scale tunneling projects.CTM-CEF-PPT.pptx
CTM-CEF-PPT.pptxMansimishra351962
Ėý
This document defines key accounting terms and concepts such as financial accounting, the objectives of accounting, users of accounting information, basic accounting terms, final accounts including the profit and loss account and balance sheet. It also discusses adjustments made in the accounts including closing stock, outstanding expenses, depreciation, and bad debts. Methods of depreciation such as straight-line, declining balance, and sum-of-years digits are explained. The document concludes with discussions on cost analysis, cost classification, break-even analysis, and alternative analysis.Lecture 1 - Construction Materials.pptx
Lecture 1 - Construction Materials.pptxMansimishra351962
Ėý
This document discusses building materials and concrete properties. It describes common building materials like cement, sand, aggregates and their annual consumption in India. It then covers properties of fresh concrete like workability, setting times and how admixtures can affect these. Methods for concreting in different temperatures are presented. The importance of the water-cement ratio is highlighted. Hydration products that form when cement hydrates are defined. Concepts like capillary voids, air voids and the gel-to-space ratio are explained in relation to concrete strength.M.Tech- CTM-PPT.pptx
M.Tech- CTM-PPT.pptxMansimishra351962
Ėý
This document defines financial accounting and outlines key concepts. Financial accounting involves recording, classifying, and summarizing financial transactions and events in terms of money, and communicating this information to users. Key users include owners, creditors, investors, and managers. The objectives of accounting are to determine profitability, financial position, and generate information. Final accounts include a profit and loss account and balance sheet, which are affected by adjustments like closing stock, outstanding expenses, depreciation, and provisions.HRDC Training.pptx
HRDC Training.pptxMansimishra351962
Ėý
This document discusses training and development in organizations. It covers assessing employee training needs through methods like performance analysis, observation, and testing. It also discusses different types of training programs like on-the-job training, coaching, lectures, and computer-based training. Finally, it discusses performance appraisal systems and different types of reward schemes organizations use like base pay, commissions, stock options, and pension plans to motivate employees.Union Presentation-1.pptx
Union Presentation-1.pptxMansimishra351962
Ėý
This document discusses trade unions, providing definitions and outlining their history, functions, importance, and challenges. It defines a trade union as a voluntary organization of employees or employers formed to promote and protect their collective interests through collective action. The document traces the history of trade unions from the 19th century in Britain and the US to their development in India in three phases before and after independence. It describes the militant, fraternal, and special functions of trade unions, which include collective bargaining for wages and conditions, worker welfare, and industrial dispute resolution. Reasons for joining unions include greater bargaining power and a sense of security. Challenges faced by unions include small size, funding issues, leadership problems, and politicalization.Unions Presentation -2.pptx
Unions Presentation -2.pptxMansimishra351962
Ėý
This document discusses the effects of unions. It begins by defining a trade union as a voluntary organization of employees or employers formed to promote and protect their interests through collective action. It then provides a brief historical background of unions starting in the 19th century in Britain and the US. The document outlines some of the key functions of unions such as negotiating wages and working conditions, settling disputes, and providing a sense of security for workers. It also notes some of the challenges faced by unions like small size, lack of funds, and political infighting. In closing, it lists some of the major unions currently operating in India.
Download IObit Driver Booster Pro Crack Latest Version [Updated]![Download IObit Driver Booster Pro Crack Latest Version [Updated]](https://cdn.slidesharecdn.com/ss_thumbnails/lect5-250227155726-618fad5f-250301095444-eebe0061-250305025648-101608b6-thumbnail.jpg?width=560&fit=bounds)
Download IObit Driver Booster Pro Crack Latest Version [Updated]batoribil090
Ėý
Direct License file Link Belowð
https://up-community.net/after-verification-click-go-to-download-page/
With Driver Booster 12 Pro Crack software, you can one-click to keep 15000000+ PC drivers updated for top PC performance.
Betternet VPN Premium 8.6.0.1290 Full Crack [Latest]![Betternet VPN Premium 8.6.0.1290 Full Crack [Latest]](https://cdn.slidesharecdn.com/ss_thumbnails/slidsahre-file-250220164342-7ea7fa5f-250303081849-fb582ea0-thumbnail.jpg?width=560&fit=bounds)
Betternet VPN Premium 8.6.0.1290 Full Crack [Latest]abbaskanju3
Ėý
Direct License file Link Belowð https://click4pc.com/after-verification-click-go-to-download-page/
Betternet VPN Crack is an impressive application that can be used to browse the Internet anonymously or use other IP addresses and have the opportunity to visit any website. This application enables you to connect to a VPN server and enjoy the protection of IP trackers on the Internet.
The Power of Exterior Models in Shaping Architectural Vision.pdf
The Power of Exterior Models in Shaping Architectural Vision.pdfMaadhu Creatives-Model Making Company
Ėý
This PDF explains the importance of exterior models in architecture. It shows how these models, whether physical or digital, help architects see designs, improve ideas, and communicate clearly with clients and others. The PDF also talks about how exterior models help with client collaboration, testing how buildings fit into their environment, and marketing. It compares exterior models with other tools like CAD drawings, 3D renderings, and prototypes. In the end, it highlights how exterior models help create buildings that look good and work well.Sirens and Mermaids, from the Middle Ages to the 20th century, paintings.ppsx
Sirens and Mermaids, from the Middle Ages to the 20th century, paintings.ppsxguimera
Ėý
an animal woman, sensual, erotic, wild, indomitable, tempting, evil, dangerous,
but sometimes sympathetic and innocent ...
MiniTool Partition Wizard Professional Edition 10.2.1 Crack
MiniTool Partition Wizard Professional Edition 10.2.1 Crackcrackstore786
Ėý
COPY & PASTE LINKððð https://crackedstore.co/after-verification-click-go-to-download-page/
It is a powerful tool that can help you with various tasks such as resizing, moving, copying, merging, splitting, converting, and recovering partitions.
Latest FL Studio Crack 24 Free Serial Key [2025]![Latest FL Studio Crack 24 Free Serial Key [2025]](https://cdn.slidesharecdn.com/ss_thumbnails/lect5-250227155726-618fad5f-250301095444-eebe0061-250305025648-101608b61-250305070125-22a1140c-thumbnail.jpg?width=560&fit=bounds)
Latest FL Studio Crack 24 Free Serial Key [2025]abbaskanju3
Ėý
Direct License file Link Belowð https://click4pc.com/after-verification-click-go-to-download-page/ It totally reworks the user interface and adds exciting new features you have been asking for. FL Studio 12 is the fastest way âĶ
IDM Full Crack 6.42 Build 27 Retail & Patch [Latest 2025]![IDM Full Crack 6.42 Build 27 Retail & Patch [Latest 2025]](https://cdn.slidesharecdn.com/ss_thumbnails/promotion-of-indian-languages-art-culture-by-madan-kumar-singh-arms-aizawl-250308140648-0f004010-250308173244-dc7cf042-thumbnail.jpg?width=560&fit=bounds)
IDM Full Crack 6.42 Build 27 Retail & Patch [Latest 2025]usmankhan66g66
Ėý
https://crackedios.com/after-verification-click-go-to-download-page/
Internet Download Manager (IDM) is a download accelerator to increase download speeds by up to 8 times, resume, organize and schedule downloads. IDM will also repair broken and resume interrupted downloads due to lost connections, network problems, computer shutdowns, or unexpected power outages.
https://crackedios.com/after-verification-click-go-to-download-page/
Latest-Wondershare Filmora Crack Free Download
Latest-Wondershare Filmora Crack Free Downloadcrackstore786
Ėý
COPY & PASTE LINKððð https://crackedstore.co/after-verification-click-go-to-download-page/
Creating a text crack effect to give the text in your videos a vibrant and classy look has become easier with Filmora. Using Filmora, you can create highly ...
Janhvi Kapoor Birthday: Janhvi Kapoor entered the film world without Sridevi'...
Janhvi Kapoor Birthday: Janhvi Kapoor entered the film world without Sridevi'...SEOExecutive1
Ėý
Today, on 6 March, Bollywood actress Janhvi Kapoor is celebrating her 28th birthday. Janhvi Kapoor is the elder daughter of late actress Sridevi. It has been 7 years since she entered the film industry.promotion-of-indian-languages-art-culture-by-madan-kumar-singh-arms-aizawl.pptx
promotion-of-indian-languages-art-culture-by-madan-kumar-singh-arms-aizawl.pptxShashikant Tewary
Ėý
Promotion of Indian Languages Art Culture by Madan Kumar Singh Arms AizawlInternational womens day 2025 submissions (1).pdf
International womens day 2025 submissions (1).pdfHebaBakr6
Ėý
International womens day 2025 submissions (1).pdfIObit Smart Defrag Pro 9.2.0.323 Crack + Key 2024 [Latest]![IObit Smart Defrag Pro 9.2.0.323 Crack + Key 2024 [Latest]](https://cdn.slidesharecdn.com/ss_thumbnails/slidsahre-file-250220164342-7ea7fa5f2-250303081403-c780870e-thumbnail.jpg?width=560&fit=bounds)
IObit Smart Defrag Pro 9.2.0.323 Crack + Key 2024 [Latest]abbaskanju3
Ėý
Direct License file Link Belowð https://click4pc.com/after-verification-click-go-to-download-page/
IObit Smart Defrag Pro Crack is a powerful Free Disk Defragmenter that accelerates the whole system with fast and efficient disk defragment. Based on IObit latest disk defrag engine and âBoot Time Disk Defragâ technology, it created with the worldâs leading defragmentation ability.
Wondershare Dr.Fone V13.1.0.19 Final Crack Full Version
Wondershare Dr.Fone V13.1.0.19 Final Crack Full Versionabbaskanju3
Ėý
Direct License file Link Belowð https://click4pc.com/after-verification-click-go-to-download-page/
Wondershare Dr.Fone Crack Free Download 2025. For the former, you need to connect the device to your PC, and then the application will scan its ..What Makes a Miniature Train Model Valuable Key Factors Behind Its Worth
What Makes a Miniature Train Model Valuable Key Factors Behind Its WorthTrain Scale Model
Ėý
This PDF explains what makes miniature train models valuable. It focuses on the importance of good craftsmanship, detailed design, and functional features. Rarity and limited editions are key factors in driving up value, as well as well-known brands like MÃĪrklin and Lionel. The document also highlights how a model's condition, especially if it's in mint condition with original packaging, affects its worth. Lastly, it discusses how models representing famous trains or events can be more valuable due to their historical significance.UpstairsNeighbourStoryboardSequence.pptx
UpstairsNeighbourStoryboardSequence.pptxharleyniamh0707
Ėý
My section of storyboards for DJCAD Graduate 2025 3D Film "Upstairs Neighbor" 2024 Trend Updates: What Really Works In SEO & Content Marketing
2024 Trend Updates: What Really Works In SEO & Content MarketingSearch Engine Journal
Ėý
The future of SEO is trending toward a more human-first and user-centric approach, powered by AI intelligence and collaboration. Are you ready?
Watch as we explore which SEO trends to prioritize to achieve sustainable growth and deliver reliable results. Weâll dive into best practices to adapt your strategy around industry-wide disruptions like SGE, how to navigate the top challenges SEO professionals are facing, and proven tactics for prioritizing quality and building trust.
Youâll hear:
- The top SEO trends to prioritize in 2024 to achieve long-term success.
- Predictions for SGEâs impact, and how to adapt.
- What E-E-A-T really means, and how to implement it holistically (hint: itâs never been more important).
With Zack Kadish and Alex Carchietta, weâll show you which SEO trends to ignore and which to focus on, along with the solution to overcoming rapid, significant and disruptive Google algorithm updates.
If youâre looking to cut through the noise of constant SEO and content trends to drive success, you wonât want to miss this webinar.
Storytelling For The Web: Integrate Storytelling in your Design Process
Storytelling For The Web: Integrate Storytelling in your Design ProcessChiara Aliotta
Ėý
In this slides I explain how I have used storytelling techniques to elevate websites and brands and create memorable user experiences. You can discover practical tips as I showcase the elements of good storytelling and its applied to some examples of diverse brands/projects..More Related Content
Recently uploaded (20)
Download IObit Driver Booster Pro Crack Latest Version [Updated]
Download IObit Driver Booster Pro Crack Latest Version [Updated]batoribil090
Ėý
Direct License file Link Belowð
https://up-community.net/after-verification-click-go-to-download-page/
With Driver Booster 12 Pro Crack software, you can one-click to keep 15000000+ PC drivers updated for top PC performance.Betternet VPN Premium 8.6.0.1290 Full Crack [Latest]
Betternet VPN Premium 8.6.0.1290 Full Crack [Latest]abbaskanju3
Ėý
Direct License file Link Belowð https://click4pc.com/after-verification-click-go-to-download-page/
Betternet VPN Crack is an impressive application that can be used to browse the Internet anonymously or use other IP addresses and have the opportunity to visit any website. This application enables you to connect to a VPN server and enjoy the protection of IP trackers on the Internet.
The Power of Exterior Models in Shaping Architectural Vision.pdf
The Power of Exterior Models in Shaping Architectural Vision.pdfMaadhu Creatives-Model Making Company
Ėý
This PDF explains the importance of exterior models in architecture. It shows how these models, whether physical or digital, help architects see designs, improve ideas, and communicate clearly with clients and others. The PDF also talks about how exterior models help with client collaboration, testing how buildings fit into their environment, and marketing. It compares exterior models with other tools like CAD drawings, 3D renderings, and prototypes. In the end, it highlights how exterior models help create buildings that look good and work well.Sirens and Mermaids, from the Middle Ages to the 20th century, paintings.ppsx
Sirens and Mermaids, from the Middle Ages to the 20th century, paintings.ppsxguimera
Ėý
an animal woman, sensual, erotic, wild, indomitable, tempting, evil, dangerous,
but sometimes sympathetic and innocent ...MiniTool Partition Wizard Professional Edition 10.2.1 Crack
MiniTool Partition Wizard Professional Edition 10.2.1 Crackcrackstore786
Ėý
COPY & PASTE LINKððð https://crackedstore.co/after-verification-click-go-to-download-page/
It is a powerful tool that can help you with various tasks such as resizing, moving, copying, merging, splitting, converting, and recovering partitions.
Latest FL Studio Crack 24 Free Serial Key [2025]
Latest FL Studio Crack 24 Free Serial Key [2025]abbaskanju3
Ėý
Direct License file Link Belowð https://click4pc.com/after-verification-click-go-to-download-page/ It totally reworks the user interface and adds exciting new features you have been asking for. FL Studio 12 is the fastest way âĶ
IDM Full Crack 6.42 Build 27 Retail & Patch [Latest 2025]
IDM Full Crack 6.42 Build 27 Retail & Patch [Latest 2025]usmankhan66g66
Ėý
https://crackedios.com/after-verification-click-go-to-download-page/
Internet Download Manager (IDM) is a download accelerator to increase download speeds by up to 8 times, resume, organize and schedule downloads. IDM will also repair broken and resume interrupted downloads due to lost connections, network problems, computer shutdowns, or unexpected power outages.
https://crackedios.com/after-verification-click-go-to-download-page/Latest-Wondershare Filmora Crack Free Download
Latest-Wondershare Filmora Crack Free Downloadcrackstore786
Ėý
COPY & PASTE LINKððð https://crackedstore.co/after-verification-click-go-to-download-page/
Creating a text crack effect to give the text in your videos a vibrant and classy look has become easier with Filmora. Using Filmora, you can create highly ...Janhvi Kapoor Birthday: Janhvi Kapoor entered the film world without Sridevi'...
Janhvi Kapoor Birthday: Janhvi Kapoor entered the film world without Sridevi'...SEOExecutive1
Ėý
Today, on 6 March, Bollywood actress Janhvi Kapoor is celebrating her 28th birthday. Janhvi Kapoor is the elder daughter of late actress Sridevi. It has been 7 years since she entered the film industry.promotion-of-indian-languages-art-culture-by-madan-kumar-singh-arms-aizawl.pptx
promotion-of-indian-languages-art-culture-by-madan-kumar-singh-arms-aizawl.pptxShashikant Tewary
Ėý
Promotion of Indian Languages Art Culture by Madan Kumar Singh Arms AizawlInternational womens day 2025 submissions (1).pdf
International womens day 2025 submissions (1).pdfHebaBakr6
Ėý
International womens day 2025 submissions (1).pdfIObit Smart Defrag Pro 9.2.0.323 Crack + Key 2024 [Latest]
IObit Smart Defrag Pro 9.2.0.323 Crack + Key 2024 [Latest]abbaskanju3
Ėý
Direct License file Link Belowð https://click4pc.com/after-verification-click-go-to-download-page/
IObit Smart Defrag Pro Crack is a powerful Free Disk Defragmenter that accelerates the whole system with fast and efficient disk defragment. Based on IObit latest disk defrag engine and âBoot Time Disk Defragâ technology, it created with the worldâs leading defragmentation ability.
Wondershare Dr.Fone V13.1.0.19 Final Crack Full Version
Wondershare Dr.Fone V13.1.0.19 Final Crack Full Versionabbaskanju3
Ėý
Direct License file Link Belowð https://click4pc.com/after-verification-click-go-to-download-page/
Wondershare Dr.Fone Crack Free Download 2025. For the former, you need to connect the device to your PC, and then the application will scan its ..What Makes a Miniature Train Model Valuable Key Factors Behind Its Worth
What Makes a Miniature Train Model Valuable Key Factors Behind Its WorthTrain Scale Model
Ėý
This PDF explains what makes miniature train models valuable. It focuses on the importance of good craftsmanship, detailed design, and functional features. Rarity and limited editions are key factors in driving up value, as well as well-known brands like MÃĪrklin and Lionel. The document also highlights how a model's condition, especially if it's in mint condition with original packaging, affects its worth. Lastly, it discusses how models representing famous trains or events can be more valuable due to their historical significance.UpstairsNeighbourStoryboardSequence.pptx
UpstairsNeighbourStoryboardSequence.pptxharleyniamh0707
Ėý
My section of storyboards for DJCAD Graduate 2025 3D Film "Upstairs Neighbor" The Power of Exterior Models in Shaping Architectural Vision.pdf
The Power of Exterior Models in Shaping Architectural Vision.pdfMaadhu Creatives-Model Making Company
Ėý
Featured (20)
2024 Trend Updates: What Really Works In SEO & Content Marketing
2024 Trend Updates: What Really Works In SEO & Content MarketingSearch Engine Journal
Ėý
The future of SEO is trending toward a more human-first and user-centric approach, powered by AI intelligence and collaboration. Are you ready?
Watch as we explore which SEO trends to prioritize to achieve sustainable growth and deliver reliable results. Weâll dive into best practices to adapt your strategy around industry-wide disruptions like SGE, how to navigate the top challenges SEO professionals are facing, and proven tactics for prioritizing quality and building trust.
Youâll hear:
- The top SEO trends to prioritize in 2024 to achieve long-term success.
- Predictions for SGEâs impact, and how to adapt.
- What E-E-A-T really means, and how to implement it holistically (hint: itâs never been more important).
With Zack Kadish and Alex Carchietta, weâll show you which SEO trends to ignore and which to focus on, along with the solution to overcoming rapid, significant and disruptive Google algorithm updates.
If youâre looking to cut through the noise of constant SEO and content trends to drive success, you wonât want to miss this webinar.
Storytelling For The Web: Integrate Storytelling in your Design Process
Storytelling For The Web: Integrate Storytelling in your Design ProcessChiara Aliotta
Ėý
In this slides I explain how I have used storytelling techniques to elevate websites and brands and create memorable user experiences. You can discover practical tips as I showcase the elements of good storytelling and its applied to some examples of diverse brands/projects..Artificial Intelligence, Data and Competition â SCHREPEL â June 2024 OECD dis...
Artificial Intelligence, Data and Competition â SCHREPEL â June 2024 OECD dis...OECD Directorate for Financial and Enterprise Affairs
Ėý
This presentation by Thibault Schrepel, Associate Professor of Law at Vrije Universiteit Amsterdam University, was made during the discussion âArtificial Intelligence, Data and Competitionâ held at the 143rd meeting of the OECD Competition Committee on 12 June 2024. More papers and presentations on the topic can be found at oe.cd/aicomp.
This presentation was uploaded with the authorâs consent.
How to Leverage AI to Boost Employee Wellness - Lydia Di Francesco - SocialHR...
How to Leverage AI to Boost Employee Wellness - Lydia Di Francesco - SocialHR...SocialHRCamp
Ėý
Speaker: Lydia Di Francesco
In this workshop, participants will delve into the realm of AI and its profound potential to revolutionize employee wellness initiatives. From stress management to fostering work-life harmony, AI offers a myriad of innovative tools and strategies that can significantly enhance the wellbeing of employees in any organization. Attendees will learn how to effectively leverage AI technologies to cultivate a healthier, happier, and more productive workforce. Whether it's utilizing AI-powered chatbots for mental health support, implementing data analytics to identify internal, systemic risk factors, or deploying personalized wellness apps, this workshop will equip participants with actionable insights and best practices to harness the power of AI for boosting employee wellness. Join us and discover how AI can be a strategic partner towards a culture of wellbeing and resilience in the workplace.2024 State of Marketing Report â by Hubspot
2024 State of Marketing Report â by HubspotMarius Sescu
Ėý
https://www.hubspot.com/state-of-marketing
· Scaling relationships and proving ROI
· Social media is the place for search, sales, and service
· Authentic influencer partnerships fuel brand growth
· The strongest connections happen via call, click, chat, and camera.
· Time saved with AI leads to more creative work
· Seeking: A single source of truth
· TLDR; Get on social, try AI, and align your systems.
· More human marketing, powered by robotsEverything You Need To Know About ChatGPT
Everything You Need To Know About ChatGPTExpeed Software
Ėý
ChatGPT is a revolutionary addition to the world since its introduction in 2022. A big shift in the sector of information gathering and processing happened because of this chatbot. What is the story of ChatGPT? How is the bot responding to prompts and generating contents? Swipe through these slides prepared by Expeed Software, a web development company regarding the development and technical intricacies of ChatGPT!Product Design Trends in 2024 | Teenage Engineerings
Product Design Trends in 2024 | Teenage EngineeringsPixeldarts
Ėý
The realm of product design is a constantly changing environment where technology and style intersect. Every year introduces fresh challenges and exciting trends that mold the future of this captivating art form. In this piece, we delve into the significant trends set to influence the look and functionality of product design in the year 2024.How Race, Age and Gender Shape Attitudes Towards Mental Health
How Race, Age and Gender Shape Attitudes Towards Mental HealthThinkNow
Ėý
Mental health has been in the news quite a bit lately. Dozens of U.S. states are currently suing Meta for contributing to the youth mental health crisis by inserting addictive features into their products, while the U.S. Surgeon General is touring the nation to bring awareness to the growing epidemic of loneliness and isolation. The country has endured periods of low national morale, such as in the 1970s when high inflation and the energy crisis worsened public sentiment following the Vietnam War. The current mood, however, feels different. Gallup recently reported that national mental health is at an all-time low, with few bright spots to lift spirits.
To better understand how Americans are feeling and their attitudes towards mental health in general, ThinkNow conducted a nationally representative quantitative survey of 1,500 respondents and found some interesting differences among ethnic, age and gender groups.
Technology
For example, 52% agree that technology and social media have a negative impact on mental health, but when broken out by race, 61% of Whites felt technology had a negative effect, and only 48% of Hispanics thought it did.
While technology has helped us keep in touch with friends and family in faraway places, it appears to have degraded our ability to connect in person. Staying connected online is a double-edged sword since the same news feed that brings us pictures of the grandkids and fluffy kittens also feeds us news about the wars in Israel and Ukraine, the dysfunction in Washington, the latest mass shooting and the climate crisis.
Hispanics may have a built-in defense against the isolation technology breeds, owing to their large, multigenerational households, strong social support systems, and tendency to use social media to stay connected with relatives abroad.
Age and Gender
When asked how individuals rate their mental health, men rate it higher than women by 11 percentage points, and Baby Boomers rank it highest at 83%, saying itâs good or excellent vs. 57% of Gen Z saying the same.
Gen Z spends the most amount of time on social media, so the notion that social media negatively affects mental health appears to be correlated. Unfortunately, Gen Z is also the generation thatâs least comfortable discussing mental health concerns with healthcare professionals. Only 40% of them state theyâre comfortable discussing their issues with a professional compared to 60% of Millennials and 65% of Boomers.
Race Affects Attitudes
As seen in previous research conducted by ThinkNow, Asian Americans lag other groups when it comes to awareness of mental health issues. Twenty-four percent of Asian Americans believe that having a mental health issue is a sign of weakness compared to the 16% average for all groups. Asians are also considerably less likely to be aware of mental health services in their communities (42% vs. 55%) and most likely to seek out information on social media (51% vs. 35%).AI Trends in Creative Operations 2024 by Artwork Flow.pdf
AI Trends in Creative Operations 2024 by Artwork Flow.pdfmarketingartwork
Ėý
Creative operations teams expect increased AI use in 2024. Currently, over half of tasks are not AI-enabled, but this is expected to decrease in the coming year. ChatGPT is the most popular AI tool currently. Business leaders are more actively exploring AI benefits than individual contributors. Most respondents do not believe AI will impact workforce size in 2024. However, some inhibitions still exist around AI accuracy and lack of understanding. Creatives primarily want to use AI to save time on mundane tasks and boost productivity.Skeleton Culture Code
Skeleton Culture CodeSkeleton Technologies
Ėý
Organizational culture includes values, norms, systems, symbols, language, assumptions, beliefs, and habits that influence employee behaviors and how people interpret those behaviors. It is important because culture can help or hinder a company's success. Some key aspects of Netflix's culture that help it achieve results include hiring smartly so every position has stars, focusing on attitude over just aptitude, and having a strict policy against peacocks, whiners, and jerks.PEPSICO Presentation to CAGNY Conference Feb 2024
PEPSICO Presentation to CAGNY Conference Feb 2024Neil Kimberley
Ėý
PepsiCo provided a safe harbor statement noting that any forward-looking statements are based on currently available information and are subject to risks and uncertainties. It also provided information on non-GAAP measures and directing readers to its website for disclosure and reconciliation. The document then discussed PepsiCo's business overview, including that it is a global beverage and convenient food company with iconic brands, $91 billion in net revenue in 2023, and nearly $14 billion in core operating profit. It operates through a divisional structure with a focus on local consumers.Content Methodology: A Best Practices Report (Webinar)
Content Methodology: A Best Practices Report (Webinar)contently
Ėý
This document provides an overview of content methodology best practices. It defines content methodology as establishing objectives, KPIs, and a culture of continuous learning and iteration. An effective methodology focuses on connecting with audiences, creating optimal content, and optimizing processes. It also discusses why a methodology is needed due to the competitive landscape, proliferation of channels, and opportunities for improvement. Components of an effective methodology include defining objectives and KPIs, audience analysis, identifying opportunities, and evaluating resources. The document concludes with recommendations around creating a content plan, testing and optimizing content over 90 days.How to Prepare For a Successful Job Search for 2024
How to Prepare For a Successful Job Search for 2024Albert Qian
Ėý
The document provides guidance on preparing a job search for 2024. It discusses the state of the job market, focusing on growth in AI and healthcare but also continued layoffs. It recommends figuring out what you want to do by researching interests and skills, then conducting informational interviews. The job search should involve building a personal brand on LinkedIn, actively applying to jobs, tailoring resumes and interviews, maintaining job hunting as a habit, and continuing self-improvement. Once hired, the document advises setting new goals and keeping skills and networking active in case of future opportunities.Social Media Marketing Trends 2024 // The Global Indie Insights
Social Media Marketing Trends 2024 // The Global Indie InsightsKurio // The Social Media Age(ncy)
Ėý
A report by thenetworkone and Kurio.
The contributing experts and agencies are (in an alphabetical order): Sylwia Rytel, Social Media Supervisor, 180heartbeats + JUNG v MATT (PL), Sharlene Jenner, Vice President - Director of Engagement Strategy, Abelson Taylor (USA), Alex Casanovas, Digital Director, Atrevia (ES), Dora Beilin, Senior Social Strategist, Barrett Hoffher (USA), Min Seo, Campaign Director, Brand New Agency (KR), DeshÃĐ M. Gully, Associate Strategist, Day One Agency (USA), Francesca Trevisan, Strategist, Different (IT), Trevor Crossman, CX and Digital Transformation Director; Olivia Hussey, Strategic Planner; Simi Srinarula, Social Media Manager, The Hallway (AUS), James Hebbert, Managing Director, Hylink (CN / UK), Mundy Ãlvarez, Planning Director; Pedro Rojas, Social Media Manager; Pancho GonzÃĄlez, CCO, Inbrax (CH), Oana Oprea, Head of Digital Planning, Jam Session Agency (RO), Amy Bottrill, Social Account Director, Launch (UK), Gaby Arriaga, Founder, Leonardo1452 (MX), Shantesh S Row, Creative Director, Liwa (UAE), Rajesh Mehta, Chief Strategy Officer; Dhruv Gaur, Digital Planning Lead; Leonie Mergulhao, Account Supervisor - Social Media & PR, Medulla (IN), Aurelija PlioplytÄ, Head of Digital & Social, Not Perfect (LI), Daiana Khaidargaliyeva, Account Manager, Osaka Labs (UK / USA), Stefanie SoĖhnchen, Vice President Digital, PIABO Communications (DE), Elisabeth Winiartati, Managing Consultant, Head of Global Integrated Communications; Lydia Aprina, Account Manager, Integrated Marketing and Communications; Nita Prabowo, Account Manager, Integrated Marketing and Communications; Okhi, Web Developer, PNTR Group (ID), Kei Obusan, Insights Director; Daffi Ranandi, Insights Manager, Radarr (SG), Gautam Reghunath, Co-founder & CEO, Talented (IN), Donagh Humphreys, Head of Social and Digital Innovation, THINKHOUSE (IRE), Sarah Yim, Strategy Director, Zulu Alpha Kilo (CA).Trends In Paid Search: Navigating The Digital Landscape In 2024
Trends In Paid Search: Navigating The Digital Landscape In 2024Search Engine Journal
Ėý
The search marketing landscape is evolving rapidly with new technologies, and professionals, like you, rely on innovative paid search strategies to meet changing demands.
Itâs important that youâre ready to implement new strategies in 2024.
Check this out and learn the top trends in paid search advertising that are expected to gain traction, so you can drive higher ROI more efficiently in 2024.
Youâll learn:
- The latest trends in AI and automation, and what this means for an evolving paid search ecosystem.
- New developments in privacy and data regulation.
- Emerging ad formats that are expected to make an impact next year.
Watch Sreekant Lanka from iQuanti and Irina Klein from OneMain Financial as they dive into the future of paid search and explore the trends, strategies, and technologies that will shape the search marketing landscape.
If youâre looking to assess your paid search strategy and design an industry-aligned plan for 2024, then this webinar is for you.5 Public speaking tips from TED - Visualized summary
5 Public speaking tips from TED - Visualized summarySpeakerHub
Ėý
From their humble beginnings in 1984, TED has grown into the worldâs most powerful amplifier for speakers and thought-leaders to share their ideas. They have over 2,400 filmed talks (not including the 30,000+ TEDx videos) freely available online, and have hosted over 17,500 events around the world.
With over one billion views in a year, itâs no wonder that so many speakers are looking to TED for ideas on how to share their message more effectively.
The article â5 Public-Speaking Tips TED Gives Its Speakersâ, by Carmine Gallo for Forbes, gives speakers five practical ways to connect with their audience, and effectively share their ideas on stage.
Whether you are gearing up to get on a TED stage yourself, or just want to master the skills that so many of their speakers possess, these tips and quotes from Chris Anderson, the TED Talks Curator, will encourage you to make the most impactful impression on your audience.
See the full article and more summaries like this on SpeakerHub here: https://speakerhub.com/blog/5-presentation-tips-ted-gives-its-speakers
See the original article on Forbes here:
http://www.forbes.com/forbes/welcome/?toURL=http://www.forbes.com/sites/carminegallo/2016/05/06/5-public-speaking-tips-ted-gives-its-speakers/&refURL=&referrer=#5c07a8221d9bChatGPT and the Future of Work - Clark Boyd 
ChatGPT and the Future of Work - Clark Boyd Clark Boyd
Ėý
Everyone is in agreement that ChatGPT (and other generative AI tools) will shape the future of work. Yet there is little consensus on exactly how, when, and to what extent this technology will change our world.
Businesses that extract maximum value from ChatGPT will use it as a collaborative tool for everything from brainstorming to technical maintenance.
For individuals, now is the time to pinpoint the skills the future professional will need to thrive in the AI age.
Check out this presentation to understand what ChatGPT is, how it will shape the future of work, and how you can prepare to take advantage. Getting into the tech field. what next 
Getting into the tech field. what next Tessa Mero
Ėý
The document provides career advice for getting into the tech field, including:
- Doing projects and internships in college to build a portfolio.
- Learning about different roles and technologies through industry research.
- Contributing to open source projects to build experience and network.
- Developing a personal brand through a website and social media presence.
- Networking through events, communities, and finding a mentor.
- Practicing interviews through mock interviews and whiteboarding coding questions.Google's Just Not That Into You: Understanding Core Updates & Search Intent
Google's Just Not That Into You: Understanding Core Updates & Search IntentLily Ray
Ėý
1. Core updates from Google periodically change how its algorithms assess and rank websites and pages. This can impact rankings through shifts in user intent, site quality issues being caught up to, world events influencing queries, and overhauls to search like the E-A-T framework.
2. There are many possible user intents beyond just transactional, navigational and informational. Identifying intent shifts is important during core updates. Sites may need to optimize for new intents through different content types and sections.
3. Responding effectively to core updates requires analyzing "before and after" data to understand changes, identifying new intents or page types, and ensuring content matches appropriate intents across video, images, knowledge graphs and more.How to have difficult conversations 
How to have difficult conversations Rajiv Jayarajah, MAppComm, ACC
Ėý
Stop putting off having difficult conversations. Seven practical tips to ensure your next difficult conversation go smoothly. Artificial Intelligence, Data and Competition â SCHREPEL â June 2024 OECD dis...
Artificial Intelligence, Data and Competition â SCHREPEL â June 2024 OECD dis...OECD Directorate for Financial and Enterprise Affairs
Ėý
cpm bar chART.docx
- 1. 0 10 20 30 40 50 60 70 80 classwork software labs seminars minors presentations assignments end exams project Chart Title semester4 semester3 semester2 semester-1