Cricket Analysis using statistics
ŌĆóDownload as DOCX, PDFŌĆó
0 likesŌĆó1,411 views

This document analyzes India's chances of winning the T20 World Cup through a statistical analysis of their previous performances. It calculates that India's average score in winning matches is 169 runs based on an average run rate of 8.463 runs per over. It then estimates that with the current team, India could score an average of 162 runs per innings. There is a 35% chance that India could win a match scoring 162 runs in 20 overs, based on comparing their average run rate to previous winning run rates. The document recommends changes to the batting order and focusing key players to increase the scoring rate above the average required for victory.


Cricket Analysis using statistics
- 1. Can India prevail? A statistical analysis of the ongoing T20 worldcup 3/21/2014 Submitted by: Sugyan Panda, SIOM
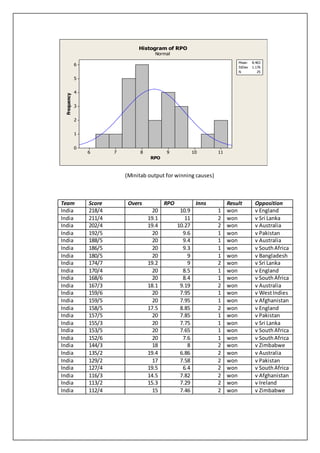
- 2. Can India Prevail? For the IndiancricketfansIndiahas alwaysbeenamostfavourednationforany cricketcup. The winningof firsteverT20 worldcuphas increasedtheirexpectationbymanyfolds.Afterthe first one IndiacouldnŌĆÖtperformuptotheirexpectationinanyotherT20 worldcup. Here is an analysisshowingthe potential of the currentteamto winanother worldcup.The stepby stepanalysisrepresentsthe currentsituation,whocouldbe the possiblekeyplayersandwhat changescan be done inthe currentway of playing. The Process: Step 1: Average total score in one innings in winning causes How isit calculated? ’éĘ Complete dataforthe winningcausesare taken ’éĘ Average runsperoverwas calculated ’éĘ Average total score for1 inningswascalculated (20*avgrpo) Thismethodof calculatingthe average score removesthe no.of overIndia battedwhen theyplayedin2nd inningsanditalsoremovesthe biasnessarisesdue tosituational batting. Inferences: ’éĘ The average RPO calculatedwas8.463 witha standard deviationof 1.176 ’éĘ The average total score inone inningscanbe calculatedas= 20 * 8.463 = 169.23 ’éĘ So,total inningsscore of 169 will increase the chancesof winningthe matchfor India. The averagetotal scoreof Indian team in one innings in winning causes Possibleaveragetotalscorethat can be scored by the currentIndian team in one innings What could be the possibleresults and whatwould be the strategy
- 3. 11109876 6 5 4 3 2 1 0 RPO Frequency Mean 8.463 StDev 1.176 N 25 Histogram of RPO Normal (Minitab output for winning causes) Team Score Overs RPO Inns Result Opposition India 218/4 20 10.9 1 won v England India 211/4 19.1 11 2 won v Sri Lanka India 202/4 19.4 10.27 2 won v Australia India 192/5 20 9.6 1 won v Pakistan India 188/5 20 9.4 1 won v Australia India 186/5 20 9.3 1 won v SouthAfrica India 180/5 20 9 1 won v Bangladesh India 174/7 19.2 9 2 won v Sri Lanka India 170/4 20 8.5 1 won v England India 168/6 20 8.4 1 won v SouthAfrica India 167/3 18.1 9.19 2 won v Australia India 159/6 20 7.95 1 won v WestIndies India 159/5 20 7.95 1 won v Afghanistan India 158/5 17.5 8.85 2 won v England India 157/5 20 7.85 1 won v Pakistan India 155/3 20 7.75 1 won v Sri Lanka India 153/5 20 7.65 1 won v SouthAfrica India 152/6 20 7.6 1 won v SouthAfrica India 144/3 18 8 2 won v Zimbabwe India 135/2 19.4 6.86 2 won v Australia India 129/2 17 7.58 2 won v Pakistan India 127/4 19.5 6.4 2 won v SouthAfrica India 116/3 14.5 7.82 2 won v Afghanistan India 113/2 15.3 7.29 2 won v Ireland India 112/4 15 7.46 2 won v Zimbabwe
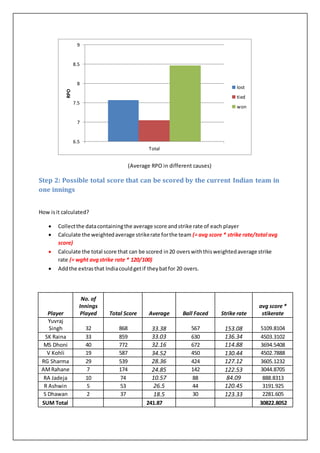
- 4. (Average RPO in different causes) Step 2: Possible total score that can be scored by the current Indian team in one innings How isit calculated? ’éĘ Collectthe datacontainingthe average score andstrike rate of each player ’éĘ Calculate the weightedaverage strikerate forthe team (= avg score * strike rate/total avg score) ’éĘ Calculate the total score that can be scored in20 overswiththisweightedaverage strike rate (= wght avgstrike rate * 120/100) ’éĘ Addthe extrasthat Indiacouldgetif theybatfor 20 overs. Player No. of Innings Played Total Score Average Ball Faced Strike rate avg score * stikerate Yuvraj Singh 32 868 33.38 567 153.08 5109.8104 SK Raina 33 859 33.03 630 136.34 4503.3102 MS Dhoni 40 772 32.16 672 114.88 3694.5408 V Kohli 19 587 34.52 450 130.44 4502.7888 RG Sharma 29 539 28.36 424 127.12 3605.1232 AMRahane 7 174 24.85 142 122.53 3044.8705 RA Jadeja 10 74 10.57 88 84.09 888.8313 R Ashwin 5 53 26.5 44 120.45 3191.925 S Dhawan 2 37 18.5 30 123.33 2281.605 SUM Total 241.87 30822.8052 6.5 7 7.5 8 8.5 9 Total RPO lost tied won
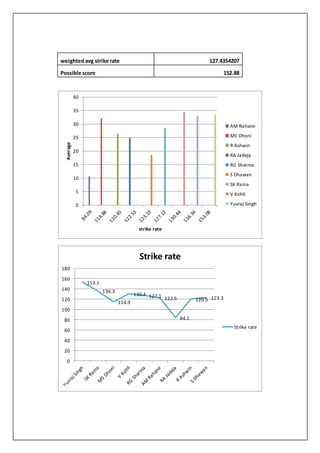
- 5. weightedavg strike rate 127.4354207 Possible score 152.88 0 5 10 15 20 25 30 35 40 Average strike rate AM Rahane MS Dhoni R Ashwin RA Jadeja RG Sharma S Dhawan SK Raina V Kohli Yuvraj Singh 153.1 136.3 114.9 130.4 127.1 122.5 84.1 120.5 123.3 0 20 40 60 80 100 120 140 160 180 Strike rate Strike rate
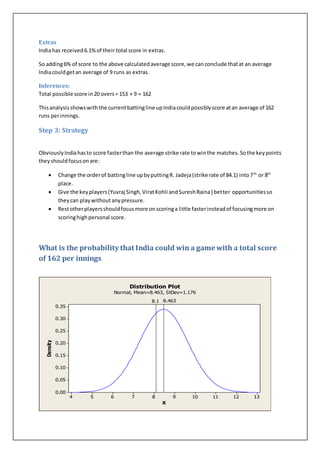
- 6. Extras Indiahas received6.1%of their total score in extras. So adding6% of score to the above calculatedaverage score,we canconclude thatat an average Indiacouldgetan average of 9 runs as extras. Inferences: Total possible score in20 overs= 153 + 9 = 162 Thisanalysis showswith the currentbattingline upIndiacouldpossiblyscore atan average of 162 runs perinnings. Step 3: Strategy ObviouslyIndiahasto score fasterthan the average strike rate towinthe matches.Sothe keypoints theyshouldfocusonare: ’éĘ Change the orderof battingline upbyputtingR. Jadeja(strike rate of 84.1) into7th or 8th place. ’éĘ Give the keyplayers(Yuvraj Singh,ViratKohli andSureshRaina) better opportunitiesso theycan playwithoutanypressure. ’éĘ Restotherplayersshouldfocusmore onscoringa little fasterinsteadof focusingmore on scoringhighpersonal score. What is the probability that India could win a game with a total score of 162 per innings 13121110987654 0.35 0.30 0.25 0.20 0.15 0.10 0.05 0.00 X Density 8.1 8.463 Distribution Plot Normal, Mean=8.463, StDev=1.176
- 7. 162 runsin an inningsisequivalentto8.1 runs perover. The average winningRPOforIndiais8.463 Calculatingthe Zvalue fromit ØæŹ = XŌłÆMean Std Deviation = 0.308 So area underthe curve = 0.148 0.5-0.148 = 0.352 So there is 35% ChancethatIndia could win the match with a score of 162 in 20 overs. 5 questions that could be askedby customer (Customer - Coach/Captain/Selector) 1. Who shouldbe takeninthe teamand whoshouldbe consideredinplaying11? 2. What shouldbe the batting/bowlingorder? 3. What are the otherfactors that affectthe teamŌĆÖsperformance? 4. Shouldtheygofor bowlingorbattingif theywinthe tossand whatare the factors influence thisdecisions? 5. What are the weaknessesof playersof against team? Source: www.espncricinfo.com