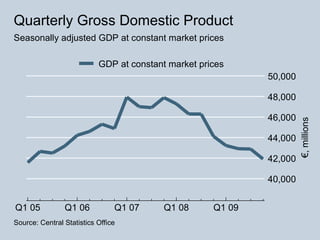
CSO Data March 2010
- 1. Ėý
- 2. Ėý
- 3. Ėý
- 4. Ėý
- 5. Ėý
- 6. Ėý
- 7. Ėý
- 8. Ėý
- 9. Ėý
- 10. Ėý
- 11. Ėý
- 12. Ėý
- 13. Ėý
- 14. Ėý
- 15. Ėý
- 16. Ėý
- 17. Commodity Value of Exports, âŽmillions % of Exports Change on 2008 Food and live animals 5,695.1 7.4% -12.9% Beverages and tobacco 981.4 1.3% -14.6% Crude materials (inedible) except fuels 833.7 1.1% -32.8% Mineral fuels 552 0.7% -30.7% Animal and vegetable oils 17.7 0.0% -55.6% Chemicals & related products 44,388.8 57.3% +8.4% Manufactured goods 1,144.2 1.5% -26.8% Machinery & transport equipment 12,530.9 16.2% -25.2% Miscellaneous manufactured goods 8,374.2 10.8% +3.3% Other and unclassified 3,015.1 3.9% +20.4% Total 77,533.0 100.0% -2.6%
- 18. Country Jan-Nov 2008 Jan-Nov 2009 % Change % Exports USA 15,344.8 16,653.7 +8.5% 21.5% Belgium 11,350.4 13,859.1 +22.1% 17.9% Great Britain 13,108.4 11,233.4 -14.3% 14.5% Germany 5,565.6 4,388.2 -21.2% 5.7% France 4,557.1 4,228.5 -7.2% 5.5% Spain 3,284.7 3,207.1 -2.4% 4.1% Netherlands 2,773.6 2,590.9 -6.6% 3.3% Italy 2,819.0 2,586.7 -8.2% 3.3% Switzerland 2,378.1 2,261.7 -4.9% 2.9% China 2,198.5 2,175.9 -1.0% 2.8% Japan 1,559.8 1,585.7 +1.7% 2.0% Northern Ireland 1,451.2 1,157.1 -20.3% 1.5% Other EU 4,596.0 3,912.3 -14.9% 5.0% Other Countries 8,649.0 7,692.7 -11.1% 9.9% Total 79,636.2 77,533.0 -2.6% 100.0%
- 19. Ėý
- 20. Ėý
- 21. Ėý
- 22. Ėý
- 23. Ėý
- 24. Ėý
- 25. Ėý
- 26. Ėý
- 27. Ėý
- 28. Ėý
- 29. Ėý
- 30. Ėý
- 31. Ėý
- 32. Ėý
- 33. Ėý
- 34. Ėý
- 35. Ėý
- 36. Ėý


