ݺߣ

ݺߣShare a Scribd company logo
CHAPTER C V
                             DATA ANALYSIS AND INTERPRETATION

                         Table 5.12      Gender classification of Customer


            S.No.     Diseases affects in work environment    Frequency      Percentage
              1      Male                                         38            76%
              2      Female                                       12            24%
                     Total                                        50            100

                       Chart 5.12     Diseases affect you in work environment


Inference

                  The above table shows that 76% of respondent are male and 24% of respondent
are female.
Table 5.1 Age wise classification of Respondents


             S.No.     Age in Years       No. of Respondents         Percentage
               1           20-30                   35                    35%
               2           31-40                   10                    10%
               3           41-50                    3                    3%
               4       Above 50 year                2                    2%
                           Total                   50                    100


                      Chart 5.1 Age wise classification of Respondents


Inference:


       The above table indicates 35 percentage of the respondents belong to 32-30 years of old,
10 percentage of the respondents belongs to 31-40 of years, 3 percentage of the respondents
belongs to 41-50 years of old, 2 percentage of the respondents belong to Above 50 years old
category
Table 5.2 Timely in Customer Need

                 S.No.        Timely       No. Of Respondents Percentage

                   1      Very Good                  27               22%
                   2      Good                       17               13%
                   3      Average                    3                29%
                   4      Fair                       1                14%
                   5      Poor                       2                16%
                          Total                      50                100

                              Chart 5.2 Timely in Customer Need


Inference:
       The above table shows that 22% of the respondents feel that they are very good in serving
the customers in a timely need,13% of the respondents feel that they are good in serving the
customers in a timely need, 29% of the respondents feel that they are Average in serving the
customers in a timely need, 14% of the respondents feel that they are Fair in serving the
customers in a timely need, 16% of the respondents feel that they are Poor in serving the
customers in a timely need.
Table 5.3 Staff was friendly and cheerful throughout


             S.No.           Respondents       No. of Respondents      Percentage
               1     Good                                8                16%
               2     Average                            39                78%
               3     Fair                                3                 6%
                     Total                              50                 100

                        Chart 5.3 Staff was friendly and cheerful throughout


Inference:


       The above table shows that 16% of the respondents felt that the staff was friendly and
cheerful throughout in a good manner, 78% of the respondents felt that the staff was friendly and
cheerful throughout in average manner, 6% of the respondents felt that the staff was friendly and
cheerful throughout in a Fair manner.
Table 5.4 Response to customer queries In Company


    S.No.      Respondents                         No. of Respondents     Percentage

       1     Very Good                                      15               30%

       2     Good                                           8                16%

       3     Average                                        27               54%

             Total                                          50                100


                     Chart 5.4 Response to customer queries In Company


Inference:

       The above table shows that 30% of the respondents said that the customer queries are
responded by the company in a very good way. 16% of the respondents said that the customer
queries are responded by the company in a good way, 54% of the respondents said that the
customer queries are responded by the company in an average way.


                          Table 5.5 Staff knowledge in organization
S.No.             Respondents          No. of Respondents Percentage
                 1      Very good                                4              8%
                 2      Good                                    10             20%
                 3      Average                                 25             50%
                 4      Fair                                     8             16%
                 5      Poor                                     3              6%
                        Total                                   50              100


                               Chart 5.5 Staff knowledge in organization


Inference:


       The above table shows that 8% of the respondents felt that the staff has a very good
knowledge, 20% of the respondents felt that the staff has a good knowledge, 50% of the
respondents felt that the staff has a Average knowledge, 16% of the respondents felt that the staff
has a Fair knowledge and 6% of the respondents felt that the staff has a Poor knowledge in the
organization.


                                Table 5.6 Staff offered pertinent advice
S.No.          Respondents      No. of Respondents         Percentage
                 1     Very good                         3                   6%
                 2     Good                             23                   46%
                 3     Average                          13                   26%
                 4     Fair                              8                   16%
                 5     Poor                              3                   6%
                       Total                            50                   100

                               Chart 5.6 Staff offered pertinent advice


Inference:
       The above table shows that 6% of the respondents felt that the staff has offered very good
pertinent advice, 46% of the respondents felt that the staff has offered good pertinent advice,
26% of the respondents felt that the staff has offered average pertinent advice, 16% of the
respondents felt that the staff has offered Fair pertinent advice and 6% of the respondents felt
that the staff has offered Poor pertinent advice regarding the products


                              Table 5.7 Staff was courteous throughout.
S.No           Respondents          No. of Respondents      Percentage
              1 Good                                      2                 4%
              2 Average                                   26                52%
              3 Fair                                      13                26%
              4 Poor                                      9                 18%
                    Total                                 50                100

                             Chart 5.7 Staff was courteous throughout.


Inference:


       The above table shows that 4% of the respondents felt that the staff has good courteous
throughout, 52% of the respondents felt that the staff has average courteous throughout, 26% of
the respondents felt that the staff has Fair courteous throughout and 18% of the respondents felt
that the staff has Poor courteous throughout
Table 5.8 Staff carries the work as requested

                  S.No.       Respondents     No. of Respondents Percentage
                    1      Very good                    16              32%
                    2      Good                         18              36%
                    3      Average                      12              24%
                    4      Fair                         2                4%
                    5      Poor                         2                4%
                           Total                        50               100

                          Chart 5.8 Staff carries the work as requested


Inference:
       The above table shows that 32% of the respondents felt that the staff carries the work as
requested in a very good way, 36% of the respondents felt that the staff carries the work as
requested in a good way, 24% of the respondents felt that the staff carries the work as requested
in a Average way, 4% of the respondents felt that the staff carries the work as requested in a Fair
way and 4% of the respondents felt that the staff carries the work as requested in a very good
way
Table 5.9 Recommendations based on Service experience


                  S.No.     Respondents      No. of Respondents     Percentage
                     1    Good                        10                20%
                     2    Average                     25                50%
                     3    Fair                        12                24%
                     4    Poor                         3                 6%
                          Total                       50                 100

                   Chart 5.9 Recommendations based on Service experience


I
Inference:
        The above table shows that 20% of the respondents said that they rate the service as
good, 50% of the respondents said that they rate the service as Average, 24% of the respondents
said that they rate the service as Fair and 6% of the respondents said that they rate the service as
Poor.
Table 5.10 Impression about the Department visit for the first time


         S.No.               Respondents               No. of Respondent Percentage
             1 Very good                                       5               10%
             2 Good                                           12               24%
             3 Average                                        20               40%
             4 Fair                                           13               26%
                 Total                                        50               100

                         Chart 5.10 Department visit in customer first time


Inference:
       The above table shows that 10% of the respondents felt that impression created by the
department for the first time is very good, 24% of the respondents felt that impression created by
the department for the first time is good, 40% of the respondents felt that impression created by
the department for the first time is very Average and 26% of the respondents felt that impression
created by the department for the first time is Fair
Table 5.11 Overall Opinion about the service


             S.No.            Respondents           No. of Respondents      Percentage
              1      Very good                              15                 30%
              2      Good                                   22                 44%
              3      Average                                10                 20
              4      Fair                                    3                 6%
                     Total                                  50                 100

                             Chart 5.11 Overall Opinion about the service


Inference:
      The above table shows that 30% of the respondents said that their overall
opinion about the service is very good, 44% of the respondents said that their
overall opinion about the service is good, 20% of the respondents said that their
overall opinion about the service is Average and 6% of the respondents said that
their overall opinion about the service is very good

More Related Content

customer service question in spss
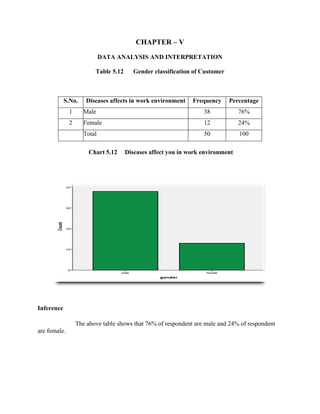
  • 1. CHAPTER C V DATA ANALYSIS AND INTERPRETATION Table 5.12 Gender classification of Customer S.No. Diseases affects in work environment Frequency Percentage 1 Male 38 76% 2 Female 12 24% Total 50 100 Chart 5.12 Diseases affect you in work environment Inference The above table shows that 76% of respondent are male and 24% of respondent are female.
  • 2. Table 5.1 Age wise classification of Respondents S.No. Age in Years No. of Respondents Percentage 1 20-30 35 35% 2 31-40 10 10% 3 41-50 3 3% 4 Above 50 year 2 2% Total 50 100 Chart 5.1 Age wise classification of Respondents Inference: The above table indicates 35 percentage of the respondents belong to 32-30 years of old, 10 percentage of the respondents belongs to 31-40 of years, 3 percentage of the respondents belongs to 41-50 years of old, 2 percentage of the respondents belong to Above 50 years old category
  • 3. Table 5.2 Timely in Customer Need S.No. Timely No. Of Respondents Percentage 1 Very Good 27 22% 2 Good 17 13% 3 Average 3 29% 4 Fair 1 14% 5 Poor 2 16% Total 50 100 Chart 5.2 Timely in Customer Need Inference: The above table shows that 22% of the respondents feel that they are very good in serving the customers in a timely need,13% of the respondents feel that they are good in serving the customers in a timely need, 29% of the respondents feel that they are Average in serving the customers in a timely need, 14% of the respondents feel that they are Fair in serving the customers in a timely need, 16% of the respondents feel that they are Poor in serving the customers in a timely need.
  • 4. Table 5.3 Staff was friendly and cheerful throughout S.No. Respondents No. of Respondents Percentage 1 Good 8 16% 2 Average 39 78% 3 Fair 3 6% Total 50 100 Chart 5.3 Staff was friendly and cheerful throughout Inference: The above table shows that 16% of the respondents felt that the staff was friendly and cheerful throughout in a good manner, 78% of the respondents felt that the staff was friendly and cheerful throughout in average manner, 6% of the respondents felt that the staff was friendly and cheerful throughout in a Fair manner.
  • 5. Table 5.4 Response to customer queries In Company S.No. Respondents No. of Respondents Percentage 1 Very Good 15 30% 2 Good 8 16% 3 Average 27 54% Total 50 100 Chart 5.4 Response to customer queries In Company Inference: The above table shows that 30% of the respondents said that the customer queries are responded by the company in a very good way. 16% of the respondents said that the customer queries are responded by the company in a good way, 54% of the respondents said that the customer queries are responded by the company in an average way. Table 5.5 Staff knowledge in organization
  • 6. S.No. Respondents No. of Respondents Percentage 1 Very good 4 8% 2 Good 10 20% 3 Average 25 50% 4 Fair 8 16% 5 Poor 3 6% Total 50 100 Chart 5.5 Staff knowledge in organization Inference: The above table shows that 8% of the respondents felt that the staff has a very good knowledge, 20% of the respondents felt that the staff has a good knowledge, 50% of the respondents felt that the staff has a Average knowledge, 16% of the respondents felt that the staff has a Fair knowledge and 6% of the respondents felt that the staff has a Poor knowledge in the organization. Table 5.6 Staff offered pertinent advice
  • 7. S.No. Respondents No. of Respondents Percentage 1 Very good 3 6% 2 Good 23 46% 3 Average 13 26% 4 Fair 8 16% 5 Poor 3 6% Total 50 100 Chart 5.6 Staff offered pertinent advice Inference: The above table shows that 6% of the respondents felt that the staff has offered very good pertinent advice, 46% of the respondents felt that the staff has offered good pertinent advice, 26% of the respondents felt that the staff has offered average pertinent advice, 16% of the respondents felt that the staff has offered Fair pertinent advice and 6% of the respondents felt that the staff has offered Poor pertinent advice regarding the products Table 5.7 Staff was courteous throughout.
  • 8. S.No Respondents No. of Respondents Percentage 1 Good 2 4% 2 Average 26 52% 3 Fair 13 26% 4 Poor 9 18% Total 50 100 Chart 5.7 Staff was courteous throughout. Inference: The above table shows that 4% of the respondents felt that the staff has good courteous throughout, 52% of the respondents felt that the staff has average courteous throughout, 26% of the respondents felt that the staff has Fair courteous throughout and 18% of the respondents felt that the staff has Poor courteous throughout
  • 9. Table 5.8 Staff carries the work as requested S.No. Respondents No. of Respondents Percentage 1 Very good 16 32% 2 Good 18 36% 3 Average 12 24% 4 Fair 2 4% 5 Poor 2 4% Total 50 100 Chart 5.8 Staff carries the work as requested Inference: The above table shows that 32% of the respondents felt that the staff carries the work as requested in a very good way, 36% of the respondents felt that the staff carries the work as requested in a good way, 24% of the respondents felt that the staff carries the work as requested in a Average way, 4% of the respondents felt that the staff carries the work as requested in a Fair way and 4% of the respondents felt that the staff carries the work as requested in a very good way
  • 10. Table 5.9 Recommendations based on Service experience S.No. Respondents No. of Respondents Percentage 1 Good 10 20% 2 Average 25 50% 3 Fair 12 24% 4 Poor 3 6% Total 50 100 Chart 5.9 Recommendations based on Service experience I Inference: The above table shows that 20% of the respondents said that they rate the service as good, 50% of the respondents said that they rate the service as Average, 24% of the respondents said that they rate the service as Fair and 6% of the respondents said that they rate the service as Poor.
  • 11. Table 5.10 Impression about the Department visit for the first time S.No. Respondents No. of Respondent Percentage 1 Very good 5 10% 2 Good 12 24% 3 Average 20 40% 4 Fair 13 26% Total 50 100 Chart 5.10 Department visit in customer first time Inference: The above table shows that 10% of the respondents felt that impression created by the department for the first time is very good, 24% of the respondents felt that impression created by the department for the first time is good, 40% of the respondents felt that impression created by the department for the first time is very Average and 26% of the respondents felt that impression created by the department for the first time is Fair
  • 12. Table 5.11 Overall Opinion about the service S.No. Respondents No. of Respondents Percentage 1 Very good 15 30% 2 Good 22 44% 3 Average 10 20 4 Fair 3 6% Total 50 100 Chart 5.11 Overall Opinion about the service Inference: The above table shows that 30% of the respondents said that their overall opinion about the service is very good, 44% of the respondents said that their overall opinion about the service is good, 20% of the respondents said that their overall opinion about the service is Average and 6% of the respondents said that their overall opinion about the service is very good