Cyclic Material Behaviour, Stress-Strain
- 1. Cyclic Material Behaviour • Stress-Strain response of most materials under cyclic loading is different than under single (monotonic) loading. • For fatigue analysis, it is necessary to consider the cyclic material behaviour for strength and life calculations. • Fatigue itself is a process of crack initiation and growth due to cyclic loading.
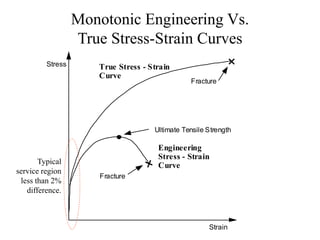
- 2. Monotonic Engineering Vs. True Stress-Strain Curves Stress Strain True Stress - Strain Curve Engineering Stress - Strain Curve Ultimate Tensile Strength Fracture Fracture Typical service region less than 2% difference.
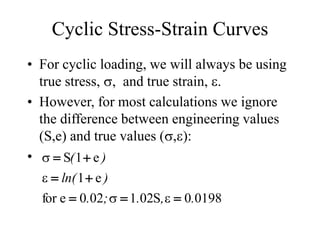
- 3. Cyclic Stress-Strain Curves • For cyclic loading, we will always be using true stress, s, and true strain, e. • However, for most calculations we ignore the difference between engineering values (S,e) and true values (s,e): • 0198 0 S 02 1 02 0 e for e 1 e 1 S . , . ; . ) ln( ) (        e s e s
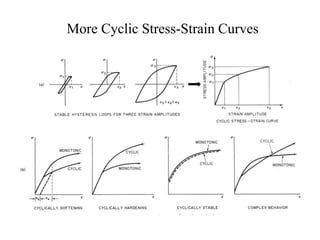
- 4. Cyclic Vs. Monotonic Stress-Strain STRAIN STRESS Monotonic Cyclic a) SAE 1045 Steel Quenched and Tempered STRAIN STRESS Monotonic b) 2024-T351 Age hardened Aluminum Alloy Cyclic For Steels: Su /Sys <1.2 - Cyclically Softens Su/Sys >1.4 - Cyclically Hardens
- 5. Elastic and Plastic Strain 0.2% offset yield stress 0.2 % STRAIN Sy (S ) y E 1 E 1 E 1 STRESS elastic plastic Total Strain e ep ee E e p e / s e e e e    A C
- 7. More Cyclic Stress-Strain Curves
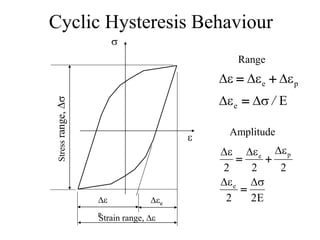
- 8. Cyclic Hysteresis Behaviour s e Stress range, Ds Strain range, De De p Dee E e p e / s D e D e D e D e D    E 2 2 2 2 2 e p e s D e D e D e D e D    Range Amplitude
- 9. Equation for s-e Curve ' ' n 1 p n p 2k' 2 2 k' 2                 s D e D e D s D n’ k’ Log(Dep/2) Log(Ds/2)
- 10. s e Equation for s-e Curve ' ' , n 1 n 1 p e p e 2k' E 2 2 Hence 2k' 2 E 2 2 2 2 2                   s D s D e D s D e D s D e D e D e D e D
- 11. Reversed Cyclic Straining • Bauchinger Effect: After being plastically strained in one direction the stress-strain curve of a metal in the opposite sense is lower than the initial stress-strain curve. • Memory: The stress for reversed plasticity is generally lowered because of the dislocation pile-ups and their back stresses left by the initial straining. The stress- strain path follows the initial path whenever the prior maximum or minimum strain level is exceeded. • Masing’s Hypothesis: Masing suggested (before dislocations were observed) that the stress-strain curve for reversed straining MEASURED FROM THE POINT OF REVERSAL would be the cyclic curve scaled by a factor of 2.
- 12. Bauchinger Effect Reversed Stress-Strain Curve Stress -Strain Curve Stress-Strain Curve Stress Strain
- 13. Masing’s Hypothesis Ds, Ds/2 De, De/2 Cyclic s-e curve Reversed s-e curve ' ' n 1 n 1 2k' 2 E 2k' 2 E 2 2 2 2                 s D s D e D s D s D e D ' n 1 2k' E 2 2         s D s D e D
- 14. Memory time Previous reversal point Deformation on previous hysteresis loop Material Memory Strain Stress Strain
- 15. Tracking Strain Sequences in s-e Space • Most components subjected to cyclic loading are susceptible to fracture by fatigue cracking and can be monitored with strain sensors (e.g., resistance foil strain-gauges) • Hence, it is common to obtain service load spectra in strain units. • The strain data must be mapped into s-e space for the specific material to do fatigue analysis.
- 17. Sequence Effects in Strain History
