際際滷

際際滷Share a Scribd company logo
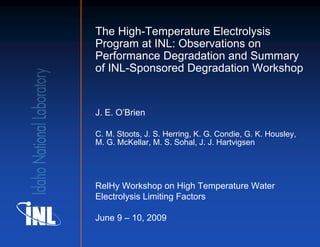
The High-Temperature Electrolysis
Program at INL: Observations on
Performance Degradation and Summary
of INL-Sponsored Degradation Workshop


J. E. OBrien

C. M. Stoots, J. S. Herring, K. G. Condie, G. K. Housley,
M. G. McKellar, M. S. Sohal, J. J. Hartvigsen


RelHy Workshop on High Temperature Water
Electrolysis Limiting Factors

June 9  10, 2009
High-Temperature Electrolysis
INL has been designated as the lead laboratory for High-Temperature
Electrolysis (HTE) research and development, under the DOE Nuclear
Hydrogen Initiative (NHI)
INL HTE Research Scope
  Experimental
  CFD Simulation
  Demonstration
  and Scale-Up
  System Modeling
System Modeling
Process flow diagram for the helium-cooled reactor / direct
Brayton / HTE system with air sweep (reference case).
System Analysis Results
                                                     Overall Hydrogen Production Efficiencies, HTE
                                                     Reference Case, as a function of Cell Voltage
                                                     0.54
                                                                                                           air swp, adiabatic, ASR 0.25
      overall hydrogen production efficiency (LHV)
                                                                                 LHV
                                                                侶H =                                       air swp, adiabatic, ASR 1.25
                                                                     2 FVop (1 / 侶th  1) + HHV            air swp, isothermal, ASR 0.25
                                                     0.52                                                  air swp, isothermal, ASR 1.25
                                                                                                           no swp, adiabatic, ASR 0.25
                                                                                                           no swp, adiabatic, ASR 1.25
                                                                                                           no swp, isothermal, ASR 0.25
                                                      0.5
                                                                                                           no swp, isothermal, ASR 1.25
                                                                                                           simple thermo analysis


                                                     0.48


                                                     0.46


                                                     0.44
                                                            1    1.05     1.1     1.15     1.2      1.25         1.3        1.35          1.4

                                                                                per-cell operating voltage

The red line follows from the definition of the overall thermal-to-hydrogen
efficiency 侶 = LHV          and direct application of the first law
                    Qi
               H

                                                                  i
System Analysis Results
                                                                                  Overall Hydrogen Production Efficiencies
                                                                                        HTE Reference Case (air sweep)

                                                    vs Hydrogen Production Rate                                                                                               vs Steam Utilization
                                                                                                3                                                                     0.5
                                                                    hydrogen production rate, m /hr


                                                                                                                            overall hydrogen production efficiency
                                                0          20,000        40,000       60,000          80,000      100,000
                                         0.51
                                                                                                                                                                     0.45
overall hydrogen production efficiency


                                          0.5                                                  adiabatic, ASR 1.25
                                                                                               isothermal, ASR 1.25                                                                              adiabatic, ASR 0.25
                                                                                               adiabatic, ASR 0.25                                                    0.4                        adiabatic, ASR 1.25
                                         0.49                                                  isothermal, ASR 0.25                                                                              isothermal, ASR 0.25
                                                                                                                                                                                                 isothermal, ASR 1.25

                                         0.48                                                                                                                        0.35


                                         0.47
                                                                                                                                                                      0.3

                                         0.46
                                                                                                                                                                     0.25
                                         0.45       Note: the high-ASR cases shown here
                                                    require ~ four times as many cells.
                                         0.44                                                                                                                         0.2
                                                                                                                                                                         0    20      40         60            80       100
                                                0           0.5             1           1.5             2             2.5
                                                                    hydrogen production rate, kg/s                                                                                  Steam Utilization

                                                                  fixed utilization                                                                                          (imax corresponds to Vtn)
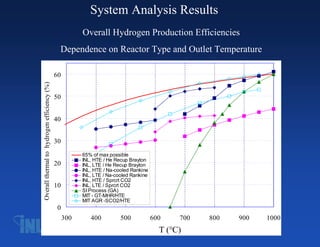
System Analysis Results
                                                        Overall Hydrogen Production Efficiencies
                                              Dependence on Reactor Type and Outlet Temperature

                                             60
Overall thermal to hydrogen efficiency (%)


                                             50


                                             40


                                             30
                                                        65% of max possible
                                                        INL, HTE / He Recup Brayton
                                             20         INL, LTE / He Recup Brayton
                                                        INL, HTE / Na-cooled Rankine
                                                        INL, LTE / Na-cooled Rankine
                                                        INL, HTE / Sprcrt CO2
                                             10         INL, LTE / Sprcrt CO2
                                                        SI Process (GA)
                                                        MIT - GT-MHR/HTE
                                                        MIT AGR -SCO2/HTE
                                              0
                                                  300      400          500            600    700   800   900   1000
                                                                                         T (属C)
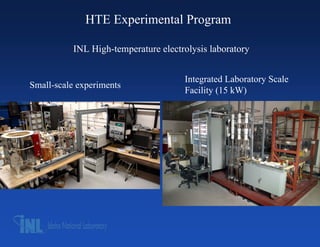
HTE Experimental Program

           INL High-temperature electrolysis laboratory


                                      Integrated Laboratory Scale
Small-scale experiments
                                      Facility (15 kW)
HTE Experimental Program

Schematic of single-cell electrolysis test apparatus
HTE Experimental Program


Exploded view of Ceramatec electrolysis stack components
HTE Experimental Program
                                       Cell Performance Characterization: Polarization curves
                                                  Button cell                                                                                                                                                                           stack
                        -1.6                                                                                        0.2                                                                    1.5
                                                          Q         = 140 sccm
                                                            s, Ar                                                                                                                                                                                                 10-3                           10-5
                                                                                                                                                                                                                theoretical open-cell potentials
                                                          Q         = 40.1 sccm
                                                            s, H2                                                                                                                                                                                                                 25-2
                                                                                                                                                                                           1.4
                                                                                                                     0                                                                                                                                         10-4
                                         cell potential                                           power density                                                                                                                                                                                     25-1


                                                                                                                                                           per-cell operating voltage, V
                        -1.4                                                                                        -0.1                                                                                                              10-2
                                                                                                                                                                                           1.3


                                                                                                                           cell power density, p (W/cm )
                                                                                      sweep Tfrn(C) Tdp,i(C)
                                                                                                                                                                                                         10-1
cell potential, E (V)


                                                                                             1    800     25.4
                                                                                             2    850     25.6                                                                             1.2
                                                                                             3    800     34.3
                        -1.2                                                                 4    850     34.4      -0.4
                                                                                             5    800     47.2                                                                             1.1
                                                                                             6    850     47.9                                                                                                                               sweep # sccm N2              sccm H2 Tdp, i (C) Tf (C)
                                                                                                                                                                                                                                                 10-1     1011              205          48.5      800
                                                                                                                                                                                            1                                                    10-2     2017              411          70.4      800


                                                                                                                                             2
                         -1                     E1            p1
                                                                                                                    -0.7                                                                                                                         10-3     1017              410          83.8      800
                                                E2            p2
                                                                                                                                                                                                                                                 10-4     2018              411          82.9      800
                                                E3            p3
                                                E4            p4                                                                                                                           0.9                                                   10-5     2018              411          83.2      830
                                                E5            p5                                                                                                                                                                                 25-1     2013              513          83.8      800
                                                E6            p6
                                                                                                                                                                                                                                                 25-2     2013              513          83.4      830
                                                                         electrolysis mode       fuel cell mode
                                                                                                                                                                                           0.8
                        -0.8                                                                                         -1                                                                          0        0.05             0.1           0.15            0.2               0.25            0.3           0.35
                                -0.6            -0.4                 -0.2                    0                    0.2                                                                                                                                                 2
                                                                                2
                                                       current density, i ( A/cm )                                                                                                                                               current density, i (A/cm )

                                                                                                                                                                                           20

                                                                                                                                                                                                         Inlet CO
                                                                                                                                                                                                                     2
                                                                                                                                                                                                                                             H
                               Outlet gas composition as a function                                                                                                                        15             Inlet H
                                                                                                                                                                                                                    2
                                                                                                                                                                                                                                                2
                                                                                                                                                           Mole % (Dry Basis)


                               of current density for co-electrolysis
                                                                                                                                                                                                                                        CO
                               experiments, 10-cell stack                                                                                                                                  10


                                                                                                                                                                                            5                                    CO
                                                                                                                                                                                                                                  2


                                                                                                                                                                                                          Inlet CO
                                                                                                                                                                                            0
                                                                                                                                                                                                 0   2          4       6      8      10            12     14
                                                                                                                                                                                                                Electrolysis Current (A)
HTE Experimental Program
                             Cell and Stack Performance Degradation


                              Area-specific resistance vs time over ~ 1000 hrs
                                                                               2.4

 1.4


 1.2                                                                            2


                                                                 2
                                                                 ASR, Ohm cm
  1
ASR                                                                            1.6

 0.8
                                                                                               increased furnace temperature from 800 C to 830 C

                                                                               1.2
 0.6

                                      OCV check
 0.4
                                                                               0.8

 0.2
       0   200      400         600          800   1000   1200                       0   200               400              600              800   1000
                          elapsed time, hr                                                                   elapsed time, hrs


                 Single button cell                                                                          Stack
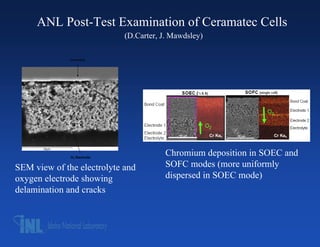
ANL Post-Test Examination of Ceramatec Cells
                             (D.Carter, J. Mawdsley)

              Electrolyte


              O2 Electrode
                                         Chromium deposition in SOEC and
SEM view of the electrolyte and          SOFC modes (more uniformly
oxygen electrode showing                 dispersed in SOEC mode)
delamination and cracks
ANL Post-Test Examination of Ceramatec Cells
                          (D.Carter, J. Mawdsley)


        Silica capping layer on H2-electrode


Si is carried by steam from the Si-bearing seal; can also originate from
interconnect plate
HTE Experimental Program
Demonstration and Scale-Up: Integrated Laboratory Scale Facility

 Exploded view of heat exchanger,
 base manifold unit, and four-stack
 electrolysis unit                    ILS modules, mounted in hot zone
HTE Experimental Program
          Integrated Laboratory Scale Facility
ILS hydrogen production rate time history


                                            Initial production rate in
                                            excess of 5 m3/hr, followed
                                            by serious degradation,
                                            some of which was related
                                            to BoP issues
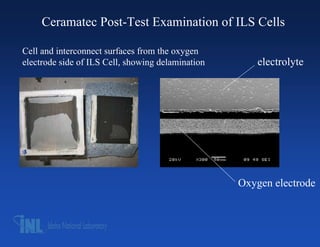
Ceramatec Post-Test Examination of ILS Cells

Cell and interconnect surfaces from the oxygen
electrode side of ILS Cell, showing delamination       electrolyte


                                                   Oxygen electrode
HTE Experimental Program
Performance Improvement: Single-cell test stand (electrode-supported cells)

   Exploded view                 Assembly view                   Photo
INL SOEC Degradation Workshop

 INL organized a workshop titled Degradation in Solid Oxide
  Electrolysis Cells and Strategies for its Mitigation, during the
  2008 Fuel Cell Seminar & Exposition in Phoenix, AZ on
  October 27, 2008.
 The workshop was attended by researchers from academia,
  national laboratories, industry, several DOE representatives,
  and a few researchers from Japan and Germany.
Summary of INL Workshop Discussion on SOEC
Degradation Mechanisms
Electrodes
     - oxygen electrode delamination
     - associated with oxygen evolution in SOEC mode
     - possible buildup of high pressures in closed porosity Redox cycling
         (can lead to electrode instability)
     - morphology change (coarsening), reducing effective surface area of
         tpb region
     - deactivation due to contaminant transport and deposition
               - chromia and silicate transport and cathode poisoning
                    (enhanced in high-steam environment)
Electrolytes
     - Phase change in electrolyte materials with aging
     - Electrolytes must be fully stabilized (mechanical strength)
Interconnects and seals
     - corrosion and non-conducting scale formation (chromia, alumina,
         silica), spallation in metallic interconnects, reaction with sealing
         glasses
     - Leakage from edge seals or cracked cells => hot spots
Mitigation Strategies
1.   protective coatings (e.g., Co, Mn spinels) and surface treatments on
     interconnects  provides a barrier to inward oxygen and outward Cr
     diffusion
2.   rare-earth surface treatments on interconnects  promote development
     of a stable conductive oxide scale
3.   fabrication techniques, materials, operating conditions (e.g., flow
     distributions, current density, utilization, steam content,)
4.   cell design, fabrication, materials
5.   Use fully stabilized mixture, add ceria or alumina
6.   Improved seals, CTE match, all-ceramic cells and stacks
Selected Additional Comments from INL Workshop

Minh (GE)
Oxygen Electrodes
    Performance: LSCF > LSF > LSM/YSZ
    Performance stability: LSCF and LSF have shown better performance
      stability than LSM/YSZ
    Degradation of LSCF electrode - similar in fuel cell, electrolysis, and
      cyclic modes, perhaps enhanced degradation in electrolysis mode
    Mixed conducting oxygen electrodes  better performance and stability
SOEC Stacks
    Degradation rate 0.2-0.3 ohm-cm2/1000 h
    Delamination and elemental migration observed at oxygen electrode
      interfaces
    Causes for observed degradation unclear - need to be identified
Selected Additional Comments from INL Workshop (cont)

    Steinberger (Forschungszentrum J端lich)
    Types of Degradation Phenomena
        Baseline degradation (continuous, steady)
            - Initialization phase (sintering, saturation)
            - constant slope phase
            - progressive degradation phase (EoL)
        degradation associated with transients
            - thermal cycle
            - redox cycle
        degradation after incidents (failures)
            - malfunction of BoP components
            - malfunction of control
            - external influence (shock, grid outage etc.)
Selected Additional Comments from INL Workshop (cont)

Tang (Versa Power)
Improved Cell Investigation
     Demonstrated significant improvement from baseline TSC2 cells
     Completed 3000 hours SOEC/SOFC testing
     Degradation rate of 39 mV/1000 hours (3 ~ 4%)

Degradation Mechanism Study Indicated
    Combined SOEC/SOFC operation has significant higher (2x to 10x)
      degradation rate compare to SOFC only operation
    Degradations from SOEC and SOFC are symmetrical
    Major cause of degradation (>90%) is the cell
    Interconnect degradation is less than 10%
Selected Additional Comments from INL Workshop (cont)

Singh (PNNL/UConn)

Bi-polar corrosion of interconnects
     Corrosion studies need to include both reducing and oxidizing environments on
       either side of interconnects
Glass seals
     Reactions with metallic interconnects to form chromates

Hydrogen Electrode poisoning by Si
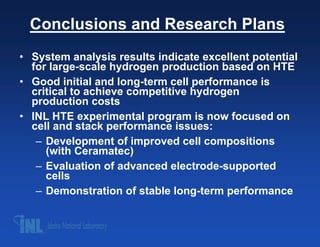
Conclusions and Research Plans
 System analysis results indicate excellent potential
  for large-scale hydrogen production based on HTE
 Good initial and long-term cell performance is
  critical to achieve competitive hydrogen
  production costs
 INL HTE experimental program is now focused on
  cell and stack performance issues:
    Development of improved cell compositions
     (with Ceramatec)
    Evaluation of advanced electrode-supported
     cells
    Demonstration of stable long-term performance
More Information is available in numerous publications
from our group!


                  Thank You!
More Related Content

D09.06.05.presentation

  • 1. The High-Temperature Electrolysis Program at INL: Observations on Performance Degradation and Summary of INL-Sponsored Degradation Workshop J. E. OBrien C. M. Stoots, J. S. Herring, K. G. Condie, G. K. Housley, M. G. McKellar, M. S. Sohal, J. J. Hartvigsen RelHy Workshop on High Temperature Water Electrolysis Limiting Factors June 9 10, 2009
  • 2. High-Temperature Electrolysis INL has been designated as the lead laboratory for High-Temperature Electrolysis (HTE) research and development, under the DOE Nuclear Hydrogen Initiative (NHI)
  • 3. INL HTE Research Scope Experimental CFD Simulation Demonstration and Scale-Up System Modeling
  • 4. System Modeling Process flow diagram for the helium-cooled reactor / direct Brayton / HTE system with air sweep (reference case).
  • 5. System Analysis Results Overall Hydrogen Production Efficiencies, HTE Reference Case, as a function of Cell Voltage 0.54 air swp, adiabatic, ASR 0.25 overall hydrogen production efficiency (LHV) LHV 侶H = air swp, adiabatic, ASR 1.25 2 FVop (1 / 侶th 1) + HHV air swp, isothermal, ASR 0.25 0.52 air swp, isothermal, ASR 1.25 no swp, adiabatic, ASR 0.25 no swp, adiabatic, ASR 1.25 no swp, isothermal, ASR 0.25 0.5 no swp, isothermal, ASR 1.25 simple thermo analysis 0.48 0.46 0.44 1 1.05 1.1 1.15 1.2 1.25 1.3 1.35 1.4 per-cell operating voltage The red line follows from the definition of the overall thermal-to-hydrogen efficiency 侶 = LHV and direct application of the first law Qi H i
  • 6. System Analysis Results Overall Hydrogen Production Efficiencies HTE Reference Case (air sweep) vs Hydrogen Production Rate vs Steam Utilization 3 0.5 hydrogen production rate, m /hr overall hydrogen production efficiency 0 20,000 40,000 60,000 80,000 100,000 0.51 0.45 overall hydrogen production efficiency 0.5 adiabatic, ASR 1.25 isothermal, ASR 1.25 adiabatic, ASR 0.25 adiabatic, ASR 0.25 0.4 adiabatic, ASR 1.25 0.49 isothermal, ASR 0.25 isothermal, ASR 0.25 isothermal, ASR 1.25 0.48 0.35 0.47 0.3 0.46 0.25 0.45 Note: the high-ASR cases shown here require ~ four times as many cells. 0.44 0.2 0 20 40 60 80 100 0 0.5 1 1.5 2 2.5 hydrogen production rate, kg/s Steam Utilization fixed utilization (imax corresponds to Vtn)
  • 7. System Analysis Results Overall Hydrogen Production Efficiencies Dependence on Reactor Type and Outlet Temperature 60 Overall thermal to hydrogen efficiency (%) 50 40 30 65% of max possible INL, HTE / He Recup Brayton 20 INL, LTE / He Recup Brayton INL, HTE / Na-cooled Rankine INL, LTE / Na-cooled Rankine INL, HTE / Sprcrt CO2 10 INL, LTE / Sprcrt CO2 SI Process (GA) MIT - GT-MHR/HTE MIT AGR -SCO2/HTE 0 300 400 500 600 700 800 900 1000 T (属C)
  • 8. HTE Experimental Program INL High-temperature electrolysis laboratory Integrated Laboratory Scale Small-scale experiments Facility (15 kW)
  • 9. HTE Experimental Program Schematic of single-cell electrolysis test apparatus
  • 10. HTE Experimental Program Exploded view of Ceramatec electrolysis stack components
  • 11. HTE Experimental Program Cell Performance Characterization: Polarization curves Button cell stack -1.6 0.2 1.5 Q = 140 sccm s, Ar 10-3 10-5 theoretical open-cell potentials Q = 40.1 sccm s, H2 25-2 1.4 0 10-4 cell potential power density 25-1 per-cell operating voltage, V -1.4 -0.1 10-2 1.3 cell power density, p (W/cm ) sweep Tfrn(C) Tdp,i(C) 10-1 cell potential, E (V) 1 800 25.4 2 850 25.6 1.2 3 800 34.3 -1.2 4 850 34.4 -0.4 5 800 47.2 1.1 6 850 47.9 sweep # sccm N2 sccm H2 Tdp, i (C) Tf (C) 10-1 1011 205 48.5 800 1 10-2 2017 411 70.4 800 2 -1 E1 p1 -0.7 10-3 1017 410 83.8 800 E2 p2 10-4 2018 411 82.9 800 E3 p3 E4 p4 0.9 10-5 2018 411 83.2 830 E5 p5 25-1 2013 513 83.8 800 E6 p6 25-2 2013 513 83.4 830 electrolysis mode fuel cell mode 0.8 -0.8 -1 0 0.05 0.1 0.15 0.2 0.25 0.3 0.35 -0.6 -0.4 -0.2 0 0.2 2 2 current density, i ( A/cm ) current density, i (A/cm ) 20 Inlet CO 2 H Outlet gas composition as a function 15 Inlet H 2 2 Mole % (Dry Basis) of current density for co-electrolysis CO experiments, 10-cell stack 10 5 CO 2 Inlet CO 0 0 2 4 6 8 10 12 14 Electrolysis Current (A)
  • 12. HTE Experimental Program Cell and Stack Performance Degradation Area-specific resistance vs time over ~ 1000 hrs 2.4 1.4 1.2 2 2 ASR, Ohm cm 1 ASR 1.6 0.8 increased furnace temperature from 800 C to 830 C 1.2 0.6 OCV check 0.4 0.8 0.2 0 200 400 600 800 1000 1200 0 200 400 600 800 1000 elapsed time, hr elapsed time, hrs Single button cell Stack
  • 13. ANL Post-Test Examination of Ceramatec Cells (D.Carter, J. Mawdsley) Electrolyte O2 Electrode Chromium deposition in SOEC and SEM view of the electrolyte and SOFC modes (more uniformly oxygen electrode showing dispersed in SOEC mode) delamination and cracks
  • 14. ANL Post-Test Examination of Ceramatec Cells (D.Carter, J. Mawdsley) Silica capping layer on H2-electrode Si is carried by steam from the Si-bearing seal; can also originate from interconnect plate
  • 15. HTE Experimental Program Demonstration and Scale-Up: Integrated Laboratory Scale Facility Exploded view of heat exchanger, base manifold unit, and four-stack electrolysis unit ILS modules, mounted in hot zone
  • 16. HTE Experimental Program Integrated Laboratory Scale Facility ILS hydrogen production rate time history Initial production rate in excess of 5 m3/hr, followed by serious degradation, some of which was related to BoP issues
  • 17. Ceramatec Post-Test Examination of ILS Cells Cell and interconnect surfaces from the oxygen electrode side of ILS Cell, showing delamination electrolyte Oxygen electrode
  • 18. HTE Experimental Program Performance Improvement: Single-cell test stand (electrode-supported cells) Exploded view Assembly view Photo
  • 19. INL SOEC Degradation Workshop INL organized a workshop titled Degradation in Solid Oxide Electrolysis Cells and Strategies for its Mitigation, during the 2008 Fuel Cell Seminar & Exposition in Phoenix, AZ on October 27, 2008. The workshop was attended by researchers from academia, national laboratories, industry, several DOE representatives, and a few researchers from Japan and Germany.
  • 20. Summary of INL Workshop Discussion on SOEC Degradation Mechanisms Electrodes - oxygen electrode delamination - associated with oxygen evolution in SOEC mode - possible buildup of high pressures in closed porosity Redox cycling (can lead to electrode instability) - morphology change (coarsening), reducing effective surface area of tpb region - deactivation due to contaminant transport and deposition - chromia and silicate transport and cathode poisoning (enhanced in high-steam environment) Electrolytes - Phase change in electrolyte materials with aging - Electrolytes must be fully stabilized (mechanical strength) Interconnects and seals - corrosion and non-conducting scale formation (chromia, alumina, silica), spallation in metallic interconnects, reaction with sealing glasses - Leakage from edge seals or cracked cells => hot spots
  • 21. Mitigation Strategies 1. protective coatings (e.g., Co, Mn spinels) and surface treatments on interconnects provides a barrier to inward oxygen and outward Cr diffusion 2. rare-earth surface treatments on interconnects promote development of a stable conductive oxide scale 3. fabrication techniques, materials, operating conditions (e.g., flow distributions, current density, utilization, steam content,) 4. cell design, fabrication, materials 5. Use fully stabilized mixture, add ceria or alumina 6. Improved seals, CTE match, all-ceramic cells and stacks
  • 22. Selected Additional Comments from INL Workshop Minh (GE) Oxygen Electrodes Performance: LSCF > LSF > LSM/YSZ Performance stability: LSCF and LSF have shown better performance stability than LSM/YSZ Degradation of LSCF electrode - similar in fuel cell, electrolysis, and cyclic modes, perhaps enhanced degradation in electrolysis mode Mixed conducting oxygen electrodes better performance and stability SOEC Stacks Degradation rate 0.2-0.3 ohm-cm2/1000 h Delamination and elemental migration observed at oxygen electrode interfaces Causes for observed degradation unclear - need to be identified
  • 23. Selected Additional Comments from INL Workshop (cont) Steinberger (Forschungszentrum J端lich) Types of Degradation Phenomena Baseline degradation (continuous, steady) - Initialization phase (sintering, saturation) - constant slope phase - progressive degradation phase (EoL) degradation associated with transients - thermal cycle - redox cycle degradation after incidents (failures) - malfunction of BoP components - malfunction of control - external influence (shock, grid outage etc.)
  • 24. Selected Additional Comments from INL Workshop (cont) Tang (Versa Power) Improved Cell Investigation Demonstrated significant improvement from baseline TSC2 cells Completed 3000 hours SOEC/SOFC testing Degradation rate of 39 mV/1000 hours (3 ~ 4%) Degradation Mechanism Study Indicated Combined SOEC/SOFC operation has significant higher (2x to 10x) degradation rate compare to SOFC only operation Degradations from SOEC and SOFC are symmetrical Major cause of degradation (>90%) is the cell Interconnect degradation is less than 10%
  • 25. Selected Additional Comments from INL Workshop (cont) Singh (PNNL/UConn) Bi-polar corrosion of interconnects Corrosion studies need to include both reducing and oxidizing environments on either side of interconnects Glass seals Reactions with metallic interconnects to form chromates Hydrogen Electrode poisoning by Si
  • 26. Conclusions and Research Plans System analysis results indicate excellent potential for large-scale hydrogen production based on HTE Good initial and long-term cell performance is critical to achieve competitive hydrogen production costs INL HTE experimental program is now focused on cell and stack performance issues: Development of improved cell compositions (with Ceramatec) Evaluation of advanced electrode-supported cells Demonstration of stable long-term performance
  • 27. More Information is available in numerous publications from our group! Thank You!