Dasani Project
Download as pptx, pdf0 likes589 views

This document analyzes variability in the weights of DASANI water bottles. 75 weight measurements were taken and analyzed using time series plots, normal probability plots, I-charts, and autocorrelation plots. The data was found to be correlated and an AR(2) model was fit. Control charts were then created using the residuals, with alerts suggested for weights outside of 475-484g to reduce variability. Project engineering will verify correlations and determine the appropriate control chart method.

Dasani Project
- 1. Aaron Fuhrman Guanyu Liu Variability on DASANI water bottles
- 2. Define: ’éŚ Reduce the variability of the DASANI water bottles regarding the weight ’éŚ DASANI provides the purified bottle water with 16.9 oz which equals to 480 g. ’éŚ The process of manufacturing the bottle water has a fast consecutive pattern that might exist variations of weight(higher or lower).
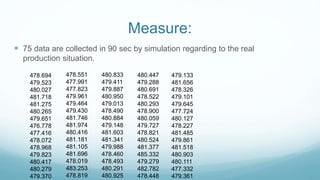
- 3. Measure: ’éŚ 75 data are collected in 90 sec by simulation regarding to the real production situation. 478.694 479.523 480.027 481.718 481.275 480.265 479.651 476.778 477.416 478.072 478.968 479.823 480.417 480.279 479.370 478.551 477.991 477.823 479.961 479.464 479.430 481.746 481.974 480.416 481.181 481.105 481.696 478.019 483.253 478.819 480.833 479.411 479.887 480.950 479.013 478.490 480.884 479.148 481.603 481.341 479.988 478.460 478.493 480.291 480.925 480.447 479.288 480.691 478.522 480.293 478.900 480.059 479.727 478.821 480.524 481.377 485.332 479.279 482.782 478.448 479.133 481.656 478.326 479.101 479.645 477.724 480.127 478.227 481.485 479.861 481.518 480.903 480.111 477.332 479.361
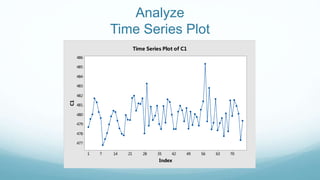
- 4. Analyze Time Series Plot 70635649423528211471 486 485 484 483 482 481 480 479 478 477 Index C1 Time Series Plot of C1
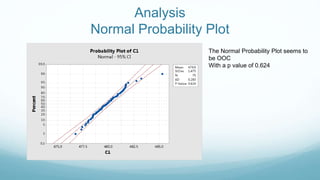
- 5. Analysis Normal Probability Plot The Normal Probability Plot seems to be OOC With a p value of 0.624
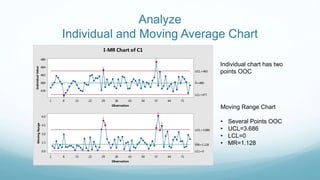
- 6. Analyze Individual and Moving Average Chart 71645750433629221581 486 484 482 480 478 Observation IndividualValue _ X=480 UCL=483 LCL=477 71645750433629221581 6.0 4.5 3.0 1.5 0.0 Observation MovingRange __ MR=1.128 UCL=3.686 LCL=0 1 1 1 1 1 1 1 1 I-MR Chart of C1 Individual chart has two points OOC Moving Range Chart ŌĆó Several Points OOC ŌĆó UCL=3.686 ŌĆó LCL=0 ŌĆó MR=1.128
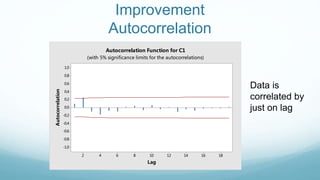
- 7. Improvement Autocorrelation 18161412108642 1.0 0.8 0.6 0.4 0.2 0.0 -0.2 -0.4 -0.6 -0.8 -1.0 Lag Autocorrelation Autocorrelation Function for C1 (with 5% significance limits for the autocorrelations) Data is correlated by just on lag
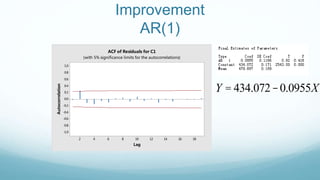
- 8. Improvement AR(1) 18161412108642 1.0 0.8 0.6 0.4 0.2 0.0 -0.2 -0.4 -0.6 -0.8 -1.0 Lag Autocorrelation ACF of Residuals for C1 (with 5% significance limits for the autocorrelations) Y = 434.072-0.0955X
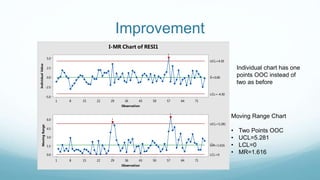
- 9. Improvement 71645750433629221581 5.0 2.5 0.0 -2.5 -5.0 Observation IndividualValue _ X=0.00 UCL=4.30 LCL=-4.30 71645750433629221581 6.0 4.5 3.0 1.5 0.0 Observation MovingRange __ MR=1.616 UCL=5.281 LCL=0 1 1 1 I-MR Chart of RESI1 Moving Range Chart ŌĆó Two Points OOC ŌĆó UCL=5.281 ŌĆó LCL=0 ŌĆó MR=1.616 Individual chart has one points OOC instead of two as before
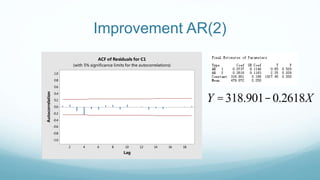
- 10. Improvement AR(2) 18161412108642 1.0 0.8 0.6 0.4 0.2 0.0 -0.2 -0.4 -0.6 -0.8 -1.0 Lag Autocorrelation ACF of Residuals for C1 (with 5% significance limits for the autocorrelations) Y =318.901-0.2618X
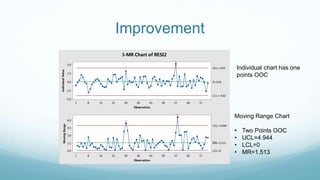
- 11. Improvement 71645750433629221581 5.0 2.5 0.0 -2.5 -5.0 Observation IndividualValue _ X=0.01 UCL=4.03 LCL=-4.02 71645750433629221581 6.0 4.5 3.0 1.5 0.0 Observation MovingRange __ MR=1.513 UCL=4.944 LCL=0 1 1 1 I-MR Chart of RESI2 Moving Range Chart ŌĆó Two Points OOC ŌĆó UCL=4.944 ŌĆó LCL=0 ŌĆó MR=1.513 Individual chart has one points OOC
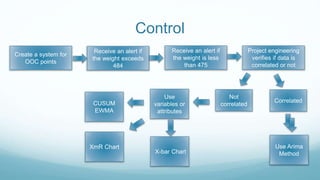
- 12. Control Receive an alert if the weight exceeds 484 Receive an alert if the weight is less than 475 Create a system for OOC points Project engineering verifies if data is correlated or not Not correlated Correlated Use variables or attributes X-bar Chart XmR Chart CUSUM EWMA Use Arima Method