Dashboard prestasi 3_1 (10)
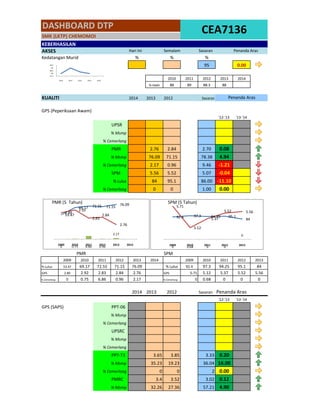
- 1. % % % 95 0.00 2010 2011 2012 2013 2014 % Hadir 88 89 88.3 88 2014 2013 2012 '12-'13 '13-'14 UPSR % Msmp % Cemerlang PMR 2.76 2.84 2.70 0.08 76.09 71.15 78.38 4.94 2.17 0.96 9.46 -1.21 SPM 5.56 5.52 5.07 -0.04 84 95.1 86.00 -11.10 0 0 1.00 0.00 PMR SPM 2009 2010 2011 2012 2013 2014 2009 2010 2011 2012 2013 % Lulus 53.47 69.17 72.55 71.15 76.09 % Lulus 92.4 97.3 94.25 95.1 84 GPS 2.89 2.92 2.83 2.84 2.76 GPS 5.71 5.12 5.37 5.52 5.56 % Cemerlang 0 0.75 6.86 0.96 2.17 % Cemerlang 0 0.68 0 0 0 2014 2013 2012 Sasaran '12-'13 '13-'14 PPT-06 UPSRC PPT-T3 3.65 3.85 3.33 0.20 35.23 19.23 36.04 16.00 0 0 2 0.00 PMRC 3.4 3.52 3.02 0.12 32.26 27.36 57.21 4.90 % Lulus % Cemerlang GPS (SAPS) % Msmp % Cemerlang PMR (5 Tahun) % Msmp Penanda Aras % Cemerlang % Cemerlang DASHBOARD DTP CEA7136 SMK (LKTP) CHEMOMOI KEBERHASILAN Penanda Aras Penanda Aras Kedatangan Murid KUALITI AKSES Hari Ini Semalam Sasaran GPS (Peperiksaan Awam) % Msmp Sasaran % Msmp % Msmp % Cemerlang SPM (5 Tahun) 0 0.75 6.86 0.96 2.17 53.47 69.17 72.55 71.15 76.09 2.89 2.92 2.83 2.84 2.76 2.6 2.7 2.8 2.9 3 0 20 40 60 80 2009 2010 2011 2012 2013 2014 87.5 88 88.5 89 89.5 2010 2011 2012 2013 2014 0 0.68 0 0 0 92.4 97.3 94.25 95.1 84 5.71 5.12 5.37 5.52 5.56 4.8 5 5.2 5.4 5.6 5.8 0 50 100 150 2009 2010 2011 2012 2013
- 2. 0 0 5 0.00 PPT-T5 6.85 6.99 7.33 6.67 0.34 67.35 52.48 76.86 55.89 -24.38 0 0 1 0.00 SPMC 6.45 6.54 6.75 5.87 0.21 72.16 68.63 87.39 71.38 -18.76 0 0 0 1 0.00 % Cemerlang % Lulus % Cemerlang % Lulus % Cemerlang
- 3. PPT-06 UPSR-C 2012 2013 2014 2012 2013 2014 % Lulus % Lulus GPS GPS % Cemerlang % Cemerlang PPT-T3 PMR-C 2012 2013 2014 2012 2013 2014 % Lulus 19.23 35.23 % Lulus 27.36 32.26 GPS 3.85 3.65 GPS 3.52 3.4 % Cemerlang 0 0 % Cemerlang 0 0 PPT-T5 SPMC 2012 2013 2014 2012 2013 2014 % Lulus 76.86 52.48 67.35 % Lulus 87.39 68.63 72.16 GPS 7.33 6.99 6.85 GPS 6.75 6.54 6.45 % Cemerlang 0 0 0 % Cemerlang 0 0 0 2014 2013 2012 Sasaran '12-'13 '13-'14 60.98 61.4 62 -0.42 4 4 4 0.00 EKUITI 2014 2013 2012 Sasaran '12-'13 '13-'14 UPSR 0 0.00 Bahasa Melayu 2 0 0.00 0 0.00 Sains 0 0.00 Matematik 0 0.00 PMR 98.91 96.15 100 2.76 77.17 72.12 87.84 5.05 97.83 92.23 97.3 5.60 98.91 97.12 97.3 1.79 SPM 98 95.16 98.99 2.84 67 60.48 67.68 6.52 84 80.49 86.87 3.51 96.39 94.23 92.41 2.16 89 86.29 82.83 2.71 Sasaran Disiplin Murid (Kes) 1 0 1.00 Hari Ini Semalam Sasaran % Guru di luar sekolah 12.2 17.07 3 -4.87 2014 2013 2012 Sasaran '12-'13 '13-'14 Penanda Aras 2 Minggu Lepas Penanda Aras Penanda Aras GURU % Guru mencapai tahap Sains Matematik INPUT MURID Minggu sebelum Sejarah Skor Komposit Band Sekolah Sains Matematik Bahasa Melayu Bahasa Inggeris Penanda Aras Murid yang gagal / tidak menguasai matapelajaran kritikal. Bahasa Melayu Bahasa Inggeris Bahasa Melayu 1 Bahasa Inggeris 3.5 3.6 3.7 3.8 3.9 0% 10% 20% 30% 40% 50% 60% 70% 80% 90% 100% 2012 2013 2014 3.3 3.35 3.4 3.45 3.5 3.55 0% 10% 20% 30% 40% 50% 60% 70% 80% 90% 100% 6.6 6.7 6.8 6.9 7 7.1 7.2 7.3 7.4 0% 10% 20% 30% 40% 50% 60% 70% 80% 90% 100% 2012 2013 2014 6.3 6.4 6.5 6.6 6.7 6.8 0% 10% 20% 30% 40% 50% 60% 70% 80% 90% 100% 0 0.2 0.4 0.6 0.8 1 1.2 0% 10% 20% 30% 40% 50% 60% 70% 80% 90% 100% 2012 2013 2014 0 0.2 0.4 0.6 0.8 1 1.2 0% 10% 20% 30% 40% 50% 60% 70% 80% 90% 100%
- 4. 81.88 90.68 95 -8.80 2014 2013 2012 Sasaran '12-'13 '13-'14 87.5 97.5 97.6 -10.00 KEPIMPINAN SEKOLAH % pencapaian tahap minimum kualiti kepimpinan. SKPM Std 1 untuk kepimpinan minimum kualiti guru - SKPM Std 4 untuk P&P
- 5. PENGLIBATAN IBU BAPA 100 125 300 -25.00 100 300 100.00 LAIN-LAIN (KOKURIKULUM) 2014 2013 2012 sasaran '12-'13 '13-'14 Penyertaan 32.43 26.73 6% 5.70 Penyertaan 2.47 1.22 3% 1.25 Penyertaan 0.45 0 1.50% 0.45 Penyertaan 0 0 0.75% 0.00 0.00 Penanda Aras Daerah Negeri Kebangsaan Penglibatan Ibu bapa di dalam program sekolah. Pengedaran Sarana Ibu Bapa Bulan semasa Penanda Aras Antarabangsa Bulan sebelum Sasaran


