


Data Exploration and Transformation.pptx
- 2. Structured data oStructured data is data whose elements are addressable for effective analysis. oIt has been organized into a formatted repository that is typically a database. oIt concerns all data which can be stored in database SQL in a table with rows and columns. oThey have relational keys and can easily be mapped into pre-designed fields. oThose data are most processed in the development and simplest way to manage information. o Example: Relational data.
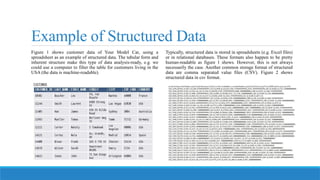
- 3. Example of Structured Data Figure 1 shows customer data of Your Model Car, using a spreadsheet as an example of structured data. The tabular form and inherent structure make this type of data analysis-ready, e.g. we could use a computer to filter the table for customers living in the USA (the data is machine-readable). Typically, structured data is stored in spreadsheets (e.g. Excel files) or in relational databases. These formats also happen to be pretty human-readable as figure 1 shows. However, this is not always necessarily the case. Another common storage format of structured data are comma separated value files (CSV). Figure 2 shows structured data in csv format.
- 4. Pros and Cons of structured data Pros of structured data There are three key benefits of structured data: 1. Easily used by machine learning algorithms 2. Easily used by business users 3. Increased access to more tools Cons of structured data The cons of structured data are centered in a lack of data flexibility. Here are some potential drawbacks to structured dataŌĆÖs use: 1. A predefined purpose limits use 2. Limited storage options
- 5. Structured data tools ŌĆóOLAP: Performs high-speed, multidimensional data analysis from unified, centralized data stores. ŌĆóSQLite: Implements a self-contained, serverless, zero-configuration, transactional relational database engine. ŌĆóMySQL: Embeds data into mass-deployed software, particularly mission-critical, heavy- load production system. ŌĆóPostgreSQL: Supports SQL and JSON querying as well as high-tier programming languages (C/C+, Java, Python, etc.).
- 6. Unstructured data oUnstructured data is a data which is not organized in a predefined manner or does not have a predefined data model, thus it is not a good fit for a mainstream relational database. oSo for Unstructured data, there are alternative platforms for storing and managing, it is increasingly prevalent in IT systems and is used by organizations in a variety of business intelligence and analytics applications. Example: Word, PDF, Text, Media logs. oThe vast majority of all data created today is unstructured. Just think of all the text, chat, video and audio content that is generated every day around the world! Unstructured data is typically easy to consume for us humans (e.g. images, videos and PDF-documents). But due to the lack of organization in the data, it is very cumbersome ŌĆō or even impossible ŌĆō for a computer to make sense of it.
- 7. Unstructured data examples There is a plethora of examples of unstructured data. Just think of any image (e.g. jpeg), video (e.g. mp4), song (e.g. mp3), documents (e.g. PDFs or docx) or any other file type. The image below shows just one concrete example of unstructured data: a product image and description text. Even though this type of data might be easy to consume for us humans, it has no degree of organization and is therefore difficult for machines to analyses and interpret.
- 8. Pros and cons of unstructured data Pros of unstructured data As there are pros and cons of structured data, unstructured data also has strengths and weaknesses for specific business needs. Some of its benefits include: 1. Freedom of the native format 2. Faster accumulation rates 3. Data lake storage Cons of unstructured data There are also cons to using unstructured data. It requires specific expertise and specialized tools in order to be used to its fullest potential. 1. Requires data science expertise 2. Specialized tools
- 9. Unstructured data tools ŌĆóMongoDB: Uses flexible documents to process data for cross-platform applications and services. ŌĆóDynamoDB: Delivers single-digit millisecond performance at any scale via built-in security, in-memory caching and backup and restore. ŌĆóHadoop: Provides distributed processing of large data sets using simple programming models and no formatting requirements. ŌĆóAzure: Enables agile cloud computing for creating and managing apps through MicrosoftŌĆÖs data centers.
- 10. Quantitative and Qualitative data
- 11. Qualitative data Qualitative data is descriptive and conceptual. Qualitative data can be categorized based on traits and characteristics. Qualitative data is non-statistical and is typically unstructured in nature. This data isnŌĆÖt necessarily measured using hard numbers used to develop graphs and charts. Instead, it is categorized based on properties, attributes, labels, and other identifiers. Qualitative data can be used to ask the question ŌĆ£why.ŌĆØ It is investigative and is often open- ended until further research is conducted. Generating this data from qualitative research is used for theorizations, interpretations, developing hypotheses, and initial understandings. Qualitative data can be generated through: ŌĆó Texts and documents ŌĆó Audio and video recordings ŌĆó Images and symbols ŌĆó Interview transcripts and focus groups ŌĆó Observations and notes
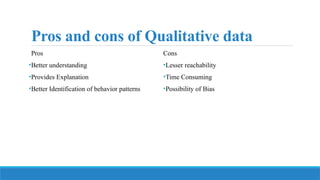
- 12. Pros and cons of Qualitative data Pros ŌĆóBetter understanding ŌĆóProvides Explanation ŌĆóBetter Identification of behavior patterns Cons ŌĆóLesser reachability ŌĆóTime Consuming ŌĆóPossibility of Bias
- 13. Quantitative data Contrary to qualitative data, quantitative data is statistical and is typically structured in nature ŌĆō meaning it is more rigid and defined. This type of data is measured using numbers and values, which makes it a more suitable candidate for data analysis. Whereas qualitative is open for exploration, quantitative data is much more concise and close-ended. It can be used to ask the questions ŌĆ£how muchŌĆØ or ŌĆ£how many,ŌĆØ followed by conclusive information. Quantitative data can be generated through: ŌĆóTests ŌĆóExperiments ŌĆóSurveys ŌĆóMarket reports ŌĆóMetrics
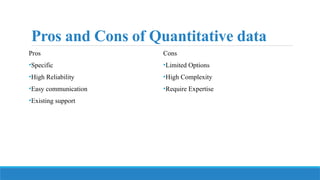
- 14. Pros and Cons of Quantitative data Pros ŌĆóSpecific ŌĆóHigh Reliability ŌĆóEasy communication ŌĆóExisting support Cons ŌĆóLimited Options ŌĆóHigh Complexity ŌĆóRequire Expertise
- 15. Four Levels of data Measurement The way a set of data is measured is called its level of measurement. Correct statistical procedures depend on a researcher being familiar with levels of measurement. Not every statistical operation can be used with every set of data. Data can be classified into four levels of measurement. They are (from lowest to highest level): 1) Nominal level 2) Ordinal level 3) Interval level 4) Ratio level
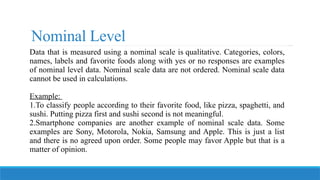
- 16. Nominal Level Data that is measured using a nominal scale is qualitative. Categories, colors, names, labels and favorite foods along with yes or no responses are examples of nominal level data. Nominal scale data are not ordered. Nominal scale data cannot be used in calculations. Example: 1.To classify people according to their favorite food, like pizza, spaghetti, and sushi. Putting pizza first and sushi second is not meaningful. 2.Smartphone companies are another example of nominal scale data. Some examples are Sony, Motorola, Nokia, Samsung and Apple. This is just a list and there is no agreed upon order. Some people may favor Apple but that is a matter of opinion.
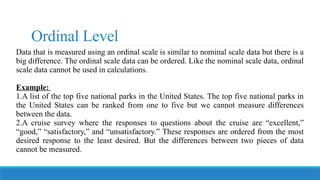
- 17. Ordinal Level Data that is measured using an ordinal scale is similar to nominal scale data but there is a big difference. The ordinal scale data can be ordered. Like the nominal scale data, ordinal scale data cannot be used in calculations. Example: 1.A list of the top five national parks in the United States. The top five national parks in the United States can be ranked from one to five but we cannot measure differences between the data. 2.A cruise survey where the responses to questions about the cruise are ŌĆ£excellent,ŌĆØ ŌĆ£good,ŌĆØ ŌĆ£satisfactory,ŌĆØ and ŌĆ£unsatisfactory.ŌĆØ These responses are ordered from the most desired response to the least desired. But the differences between two pieces of data cannot be measured.
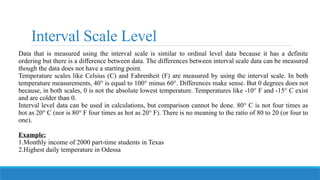
- 18. Interval Scale Level Data that is measured using the interval scale is similar to ordinal level data because it has a definite ordering but there is a difference between data. The differences between interval scale data can be measured though the data does not have a starting point. Temperature scales like Celsius (C) and Fahrenheit (F) are measured by using the interval scale. In both temperature measurements, 40┬░ is equal to 100┬░ minus 60┬░. Differences make sense. But 0 degrees does not because, in both scales, 0 is not the absolute lowest temperature. Temperatures like -10┬░ F and -15┬░ C exist and are colder than 0. Interval level data can be used in calculations, but comparison cannot be done. 80┬░ C is not four times as hot as 20┬░ C (nor is 80┬░ F four times as hot as 20┬░ F). There is no meaning to the ratio of 80 to 20 (or four to one). Example: 1.Monthly income of 2000 part-time students in Texas 2.Highest daily temperature in Odessa
- 19. Ratio Scale Level Data that is measured using the ratio scale takes care of the ratio problem and gives you the most information. Ratio scale data is like interval scale data, but it has a 0 point and ratios can be calculated. You will not have a negative value in ratio scale data. For example, four multiple choice statistics final exam scores are 80, 68, 20 and 92 (out of a possible 100 points) (given that the exams are machine-graded.) The data can be put in order from lowest to highest: 20, 68, 80, 92. There is no negative point in the final exam scores as the lowest score is 0 point. The differences between the data have meaning. The score 92 is more than the score 68 by 24 points. Ratios can be calculated. The smallest score is 0. So 80 is four times 20. If one student scores 80 points and another student scores 20 points, the student who scores higher is 4 times better than the student who scores lower. Example: 1.Weight of 200 cancer patients in the past 5 months 2.Height of 549 newborn babies 3.Diameter of 150 donuts
- 20. Data Cleaning Data cleaning is the process of preparing data for analysis by removing or modifying data that is incorrect, incomplete, irrelevant, duplicated, or improperly formatted. This data is usually not necessary or helpful when it comes to analyzing data because it may hinder the process or provide inaccurate results. There are several methods for cleaning data depending on how it is stored along with the answers being sought. Data cleaning is not simply about erasing information to make space for new data, but rather finding a way to maximize a data setŌĆÖs accuracy without necessarily deleting information.
- 21. How do you clean data? Step 1: Remove duplicate or irrelevant observations Step 2: Fix structural errors Step 3: Filter unwanted outliers Step 4: Handle missing data Step 4: Validate
Editor's Notes
- #2: Structured data ŌĆö typically categorized as quantitative data ŌĆö is highly organized and easily decipherable by╠²machine learning algorithms.╠²Developed by IBM in 1974, structured query language (SQL) is the programming language used to manage structured data. By using a╠²relational (SQL) database, business users can quickly input, search and manipulate structured data.
- #4: Easily used by machine learning (ML) algorithms:╠²The specific and organized architecture of structured data eases manipulation and querying of ML data. Easily used by business users:╠²Structured data does not require an in-depth understanding of different types of data and how they function. With a basic understanding of the topic relative to the data, users can easily access and interpret the data. Accessible by more tools:╠²Since structured data predates unstructured data, there are more tools available for using and analyzing structured data. Limited usage:╠²Data with a predefined structure can only be used for its intended purpose, which limits its flexibility and usability. Limited storage options:╠²Structured data is generally stored in data storage systems with rigid schemas (e.g., ŌĆ£data warehousesŌĆØ). Therefore, changes in data requirements necessitate an update of all structured data, which leads to a massive expenditure of time and resources. Structured data tools
- #8: Pros Native format:╠²Unstructured data, stored in its native format, remains undefined until needed. Its adaptability increases file formats in the database, which widens the data pool and enables data scientists to prepare and analyze only the data they need. Fast accumulation rates:╠²Since there is no need to predefine the data, it can be collected quickly and easily. Data lake storage:╠²Allows for massive storage and pay-as-you-use pricing, which cuts costs and eases scalability. Cons Requires expertise:╠²Due to its undefined/non-formatted nature,╠²data science╠²expertise is required to prepare and analyze unstructured data. This is beneficial to data analysts but alienates unspecialized business users who may not fully understand specialized data topics or how to utilize their data. Specialized tools:╠²Specialized tools are required to manipulate unstructured data, which limits product choices for data managers.