Data quality data verification and system assessment excel chartbook
- 1. Data Quality Review (DQR) Data verification and system Assessment Excel Chartbook
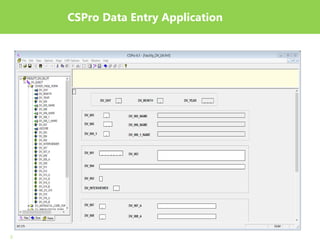
- 3. 3 CSPro Data Entry Application
- 4. 4 Create DQR Indicators in CSPro
- 5. 5 Export Data From CSPro and Paste into the Chartbook
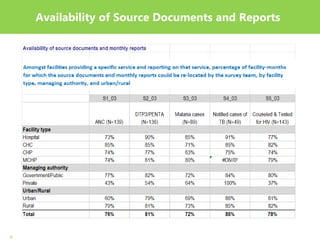
- 8. 8 Availability of Source Documents and Reports
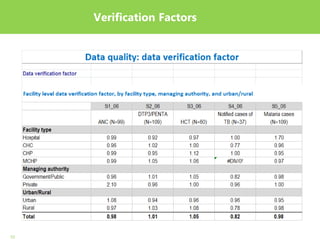
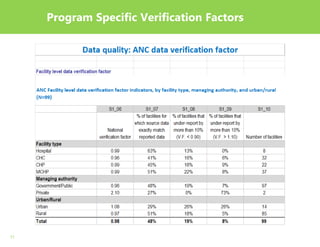
- 11. 11 Program Specific Verification Factors
- 12. 12 Program Specific – Reasons for Discrepancies
- 14. 14 System Assessment – Subnational Results
Editor's Notes
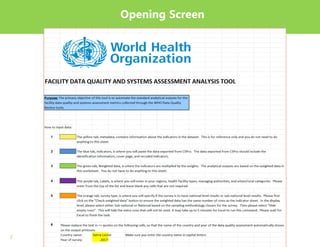
- #3: Enter Country and Year in the Yellow boxes
- #4: By design, the data are collected in the standard CSPro Data Verification application which can used for data capture in the field on tablet computers, or from entering paper-based results into the desk top back in the office after the assessment.
- #5: Once the data are in the database and cleaned, a ‘batch file’ is available to compile the relevant indicators for the analysis. Run the batch file in CSPro to compile the indicators, then export the data as a text file. From there the data can be pasted into the Excel tool.
- #6: Paste the data from CSPro (open the text file in Excel) into the DV Chartbook on the Indicators tab. NB -there are facility and district level versions of the CSPro data entry applications and batch files. There are also facility and district level versions of the Chartbook.
- #7: Enter the country specific information on stratifiers – subnational units, facility types, management authority and urban/rural.
- #8: Results are presented for all program level indicators and for each of the program indicators individually. General facility information page gives information on the availability of services in the facilities surveyed. -results are provided for national level (that is, all subnational units taken together), and also broken down by subnational unit (e.g. region or district).
- #12: There is more detail on data quality metrics in the indicator-specific tabs (e.g. % of facilities over/under reporting by >10%).
- #15: System assessment indicators (qualitative indicators) are color coded for ease of interpretation. Also ‘national’ and ‘subnational’ results tabs.


