![Print This Document
Hello. This is Brett Barr, PME for Texas Instruments Power MOSFET product line. And today, we're
going to talk about the MOSFET datasheet and switching parameters. Specifically, we're going to cover
some miscellaneous parameters such as Qrr and Qoss, as well as some timing values.
All the perimeters that we'll be discussing today are located in the electrical characteristics table in the
datasheet. First we have the output charge Qoss, which is located under dynamic characteristics. Then
we have our reverse recover charge and reverse recovery time, which pertain to the diode characteristics.
And then finally, we'll be discussing the timing values-- on-delay time, rise time, off-delay time, and fall
time, which are also located under the dynamic characteristics.
First, let's focus on Qoss and Qrr. So the output charge is the charge associated with the output
capacitance Coss. So Coss is the combined parasitic gate-to-drain capacitance of the MOSFET and drain
to source capacitance of the MOSFET. Therefore, it's necessarily determined at a specific Vds So here
we have a Coss specified at typically half of the breakdown. And similarly, we have Qoss specified at
half of the device breakdown, this case, this being a 60-volt breakdown device.
Then we have the reverse recovery charge, typically known as Qrr. And this is the body diode, intrinsic
body diode charge associated with the recombination of electrons and holes. Both of these charges are
very important, particularly in dictating Eoss losses and reverse recovery losses in synchronous
rectification applications.
So as I talk about how the values are certainly subject to how they are tested as they appear in the
datasheet, I don't want to undermine that they are critical parameters in dictating the losses in certain
applications. So just because datasheet values might be unreliable or hard to compare is not meant to
imply that these aren't very important values as it pertains to device performance in application.
With that in mind, I'd like to go through an actual measurement of Qrr for a real part. Now, Qoss is a
relatively easy parameter to extract, given that we have a known output capacitance that we've measured.
We simply need to inject that with some known current and measure the time it takes to reach the desired
Vds voltage, generally specified at half of the breakdown of the MOSFET. And from there, it's pretty
easy to calculate the output charge.
Qrr on the other hand, is actually a much more difficult parameter to discern. And you may have noticed
on the previous slide, Qrr is always specified at a given di-dt rate which it was measured. In this case, for
this part, it was 364 microsecond for this waveform at least.
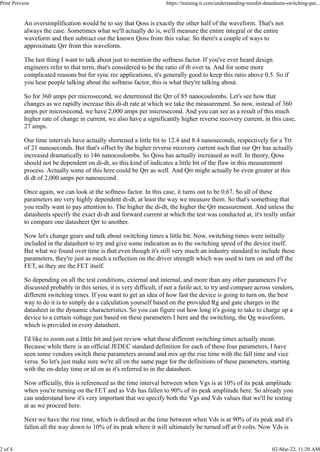
So here we have the current flowing through the body diode in the blue waveform. We're going to take
that current down at a constant di-dt of 360 amps per microsecond. For a brief amount of time, it's going
to go negative and hit a peak reverse recovery current. And then as the electrons and holes recombine,
it's going to return back to 0, as this Vds blocking voltage is applied from the drain to source of the
MOSFET.
The peak reverse recovery current that will be achieved will be 7 1/2 amps at this point right here. And
you'll notice that we can split this reverse recovery event into two separate events-- one where the
negative current is accelerating and then one where it hits a peak and starts to return back to 0, which
we'll refer to as ta and tb, respectively. The combination of which gives you your reverse recovery time
as it is found on the datasheet.
Now Qrr is generally thought to be the first half of this reverse recovery event. So the area of this
triangle can be calculated simply by multiplying the a time [? interval ?] times the max reverse recovery
current, times a factor of 1/2 half because we have a triangle wave form. And that yields 85
nanocoulombs.
Print Preview https://training.ti.com/understanding-mosfet-datasheets-switching-par...
1 of 4 02-Mar-22, 11:20 AM](https://image.slidesharecdn.com/datasheetsofmos-220721063300-a80851bb/85/DATA-SHEETS-OF-MOS-pdf-1-320.jpg)
DATA SHEETS OF MOS.pdf
- 1. Print This Document Hello. This is Brett Barr, PME for Texas Instruments Power MOSFET product line. And today, we're going to talk about the MOSFET datasheet and switching parameters. Specifically, we're going to cover some miscellaneous parameters such as Qrr and Qoss, as well as some timing values. All the perimeters that we'll be discussing today are located in the electrical characteristics table in the datasheet. First we have the output charge Qoss, which is located under dynamic characteristics. Then we have our reverse recover charge and reverse recovery time, which pertain to the diode characteristics. And then finally, we'll be discussing the timing values-- on-delay time, rise time, off-delay time, and fall time, which are also located under the dynamic characteristics. First, let's focus on Qoss and Qrr. So the output charge is the charge associated with the output capacitance Coss. So Coss is the combined parasitic gate-to-drain capacitance of the MOSFET and drain to source capacitance of the MOSFET. Therefore, it's necessarily determined at a specific Vds So here we have a Coss specified at typically half of the breakdown. And similarly, we have Qoss specified at half of the device breakdown, this case, this being a 60-volt breakdown device. Then we have the reverse recovery charge, typically known as Qrr. And this is the body diode, intrinsic body diode charge associated with the recombination of electrons and holes. Both of these charges are very important, particularly in dictating Eoss losses and reverse recovery losses in synchronous rectification applications. So as I talk about how the values are certainly subject to how they are tested as they appear in the datasheet, I don't want to undermine that they are critical parameters in dictating the losses in certain applications. So just because datasheet values might be unreliable or hard to compare is not meant to imply that these aren't very important values as it pertains to device performance in application. With that in mind, I'd like to go through an actual measurement of Qrr for a real part. Now, Qoss is a relatively easy parameter to extract, given that we have a known output capacitance that we've measured. We simply need to inject that with some known current and measure the time it takes to reach the desired Vds voltage, generally specified at half of the breakdown of the MOSFET. And from there, it's pretty easy to calculate the output charge. Qrr on the other hand, is actually a much more difficult parameter to discern. And you may have noticed on the previous slide, Qrr is always specified at a given di-dt rate which it was measured. In this case, for this part, it was 364 microsecond for this waveform at least. So here we have the current flowing through the body diode in the blue waveform. We're going to take that current down at a constant di-dt of 360 amps per microsecond. For a brief amount of time, it's going to go negative and hit a peak reverse recovery current. And then as the electrons and holes recombine, it's going to return back to 0, as this Vds blocking voltage is applied from the drain to source of the MOSFET. The peak reverse recovery current that will be achieved will be 7 1/2 amps at this point right here. And you'll notice that we can split this reverse recovery event into two separate events-- one where the negative current is accelerating and then one where it hits a peak and starts to return back to 0, which we'll refer to as ta and tb, respectively. The combination of which gives you your reverse recovery time as it is found on the datasheet. Now Qrr is generally thought to be the first half of this reverse recovery event. So the area of this triangle can be calculated simply by multiplying the a time [? interval ?] times the max reverse recovery current, times a factor of 1/2 half because we have a triangle wave form. And that yields 85 nanocoulombs. Print Preview https://training.ti.com/understanding-mosfet-datasheets-switching-par... 1 of 4 02-Mar-22, 11:20 AM
- 2. An oversimplification would be to say that Qoss is exactly the other half of the waveform. That's not always the case. Sometimes what we'll actually do is, we'll measure the entire integral or the entire waveform and then subtract out the known Qoss from this value. So there's a couple of ways to approximate Qrr from this waveform. The last thing I want to talk about just to mention the softness factor. If you've ever heard design engineers refer to that term, that's considered to be the ratio of tb over ta. And for some more complicated reasons but for sync rec applications, it's generally good to keep this ratio above 0.5. So if you hear people talking about the softness factor, this is what they're talking about. So for 360 amps per microsecond, we determined the Qrr of 85 nanocoulombs. Let's see how that changes as we rapidly increase this di-dt rate at which we take the measurement. So now, instead of 360 amps per microsecond, we have 2,000 amps per microsecond. And you can see as a result of this much higher rate of change in current, we also have a significantly higher reverse recovery current, in this case, 27 amps. Our time intervals have actually shortened a little bit to 12.4 and 8.4 nanoseconds, respectively for a Trr of 21 nanoseconds. But that's offset by the higher reverse recovery current such that our Qrr has actually increased dramatically to 146 nanocoulombs. So Qoss has actually increased as well. In theory, Qoss should not be dependent on di-dt, so this kind of indicates a little bit of the flaw in this measurement process. Actually some of this here could be Qrr as well. And Qrr might actually be even greater at this di dt of 2,000 amps per nanosecond. Once again, we can look at the softness factor. In this case, it turns out to be 0.67. So all of these parameters are very highly dependent di-dt, at least the way we measure them. So that's something that you really want to pay attention to. The higher the di-dt, the higher the Qrr measurement. And unless the datasheets specify the exact di-dt and forward current at which the test was conducted at, it's really unfair to compare one datasheet Qrr to another. Now let's change gears and talk about switching times a little bit. Now, switching times were initially included in the datasheet to try and give some indication as to the switching speed of the device itself. But what we found over time is that even though it's still very much an industry standard to include these parameters, they're just as much a reflection on the driver strength which was used to turn on and off the FET, as they are the FET itself. So depending on all the test conditions, external and internal, and more than any other parameters I've discussed probably in this series, it is very difficult, if not a futile act, to try and compare across vendors, different switching times. If you want to get an idea of how fast the device is going to turn on, the best way to do it is to simply do a calculation yourself based on the provided Rg and gate charges in the datasheet in the dynamic characteristics. So you can figure out how long it's going to take to charge up a device to a certain voltage just based on these parameters I here and the switching, the Qg waveform, which is provided in every datasheet. I'd like to zoom out a little bit and just review what these different switching times actually mean. Because while there is an official JEDEC standard definition for each of these four parameters, I have seen some vendors switch these parameters around and mix up the rise time with the fall time and vice versa. So let's just make sure we're all on the same page for the definitions of these parameters, starting with the on-delay time or td on as it's referred to in the datasheet. Now officially, this is referenced as the time interval between when Vgs is at 10% of its peak amplitude when you're turning on the FET and as Vds has fallen to 90% of its peak amplitude here. So already you can understand how it's very important that we specify both the Vgs and Vds values that we'll be testing at as we proceed here. Next we have the rise time, which is defined as the time between when Vds is at 90% of its peak and it's fallen all the way down to 10% of its peak where it will ultimately be turned off at 0 volts. Now Vds is Print Preview https://training.ti.com/understanding-mosfet-datasheets-switching-par... 2 of 4 02-Mar-22, 11:20 AM
- 3. falling, so why do we call this the rise time? Rise time actually refers to the rising current during the device turn on. And I think that's the source of some confusion is some would refer to the rising Vds during turn off as the rise time, and that would be incorrect by the JEDEC definition. Then the FET is going to be on conducting for some time until we proceed to turn off the device. First we have once again, a delay time, this time the off-delay time, which is similarly defined as the time when Vgs is now at 90% of its peak and its falling. And Vds is once again going to rise. And once it hits 10% of its peak, that would be the time interval for turn-off delay time. Finally, we have the fall time-- once again, referring to the falling current of the device. And here we have the time interval from when Vds is at 10% of its peak amplitude, all the way back up to 90% of what it will be when completely turned off. Returning to what I said earlier, which was that these switching times were just as much a function of the strength of the driver turning them on and off, as they were the device under test themselves, here we go through a specific example for a 25-volt MOSFET, the CSD16401Q5. And you have similar, although more realistic waveforms to what we saw in the previous slide. The Ids for this MOSFET was tested at 40 amps. The Vds was tested at half of breakdown, so in this case, 12.5 volts. And the gate-to-source voltage peak at fully enhanced mode is 4 1/2 volts Vgs, with an external 2-ohm resistor applied between the gate of the device and the driver. So this waveform shows the case of a single driver being used. If we were to use two drivers, effectively doubling the strength of the driving current, you would see that the time intervals have all shortened respectively, as you would suspect. The device is turning on more quickly. And we can repeat this with three drivers, and go all the way to four drivers. And we see in each case, a steepening of the waveform itself. Let's look at what the actual data looks like for these different conditions. And we see that as we go from one to four drivers, our on-delay time has decreased from 25 to 14 nanoseconds. Our rise time has decreased substantially from 42 to 25 nanoseconds. Our off-delay time has decreased from 27 to 19 nanoseconds. And finally, our fall time has decreased from 17 to 9 seconds. So driver strength is not generally a parameter listed in the datasheet. It is not listed in the test conditions for switching times. And really, the take-home point is, unless the exact same board is used to test one switching time set to another FET's switching times, there is no real way of knowing if you're getting a fair comparison between these parameters. They're what a mentor of mine once referred to as the most useless parameters that appear on the datasheet. It is still industry standard to include them, but they do not hold much value or weight. As mentioned earlier, it would be more applicable to calculate the turn on and off times for yourself based on the gate charge and gate resistor values provided in the electrical characteristics table of the datasheet. OK. Let's summarize what we discussed today. Today we talked about some switching charges-- Qrr and Qoss. We said that they cannot be neglected or ignored, as they are crucial to the device performance, particularly in certain applications, like a synchronous rectification. However, Qrr in particular is a difficult parameter to measure. And it's highly dependent on both forward-body current through the diode, as well as the di-dt at which the measurement took place. To get a fair comparison for this parameter, we really need to measure parts on the same board under the same conditions. Similarly, the timing values are highly dependent on the test conditions, some of which are listed in the datasheet, such as Vgs, Ids, and Rg. Some of which are not listed in the datasheet, such as the current of the driver, which was used to switch on and off the FETs. They can be manipulated with driver strength, and they are not necessarily a good indicator of how fast the device can switch. You are better off referring to the gate charges and gate resistances provided in the electrical characteristics table. Print Preview https://training.ti.com/understanding-mosfet-datasheets-switching-par... 3 of 4 02-Mar-22, 11:20 AM
- 4. Once again, I thank you for joining me today. And for more information about TI's next FET, power MOSFET devices, I would urge you to go to ti.com/MOSFET. Print Preview https://training.ti.com/understanding-mosfet-datasheets-switching-par... 4 of 4 02-Mar-22, 11:20 AM