Data Storytelling with the DIKW Pyramid.pdf
0 likes116 views

Angelica Lo Duca, a researcher and professor, discusses data storytelling as a method to present data insights in an engaging way that inspires action. The presentation focuses on transforming data visualizations into compelling narratives, using the DIKW pyramid and examples in Python with Altair. A case study example illustrates how to motivate funding proposals for homelessness interventions in Italy through effective data communication.


![A first example
import pandas as pd
import altair as alt
df = pd.DataFrame({
'value' : [3,2,4],
'category' : ['M','N','O']
})
chart = alt.Chart(df
).mark_bar(
).encode(
x = 'value:Q',
y = 'category:N'
)
chart](https://image.slidesharecdn.com/datastorytellingwiththedikwpyramid-230804141637-deb43be7/85/Data-Storytelling-with-the-DIKW-Pyramid-pdf-22-320.jpg)


Data Storytelling with the DIKW Pyramid.pdf
- 1. Data Storytelling with the DIKW Pyramid Angelica Lo Duca, PhD Researcher @ IIT-CNR
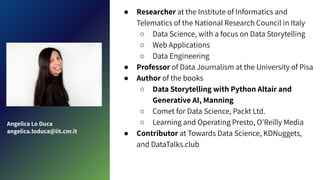
- 2. ˇń Researcher at the Institute of Informatics and Telematics of the National Research Council in Italy ˇđ Data Science, with a focus on Data Storytelling ˇđ Web Applications ˇđ Data Engineering ˇń Professor of Data Journalism at the University of Pisa ˇń Author of the books ˇđ Data Storytelling with Python Altair and Generative AI, Manning ˇđ Comet for Data Science, Packt Ltd. ˇđ Learning and Operating Presto, OˇŻReilly Media ˇń Contributor at Towards Data Science, KDNuggets, and DataTalks.club Angelica Lo Duca angelica.loduca@iit.cnr.it
- 3. Data storytelling is building stories supported by data, allowing analysts and data scientists to present and share their insights to engage the audience and inspire them to make decisions.
- 4. In this talk, we will focus on how to transform a data visualization chart into a data story.
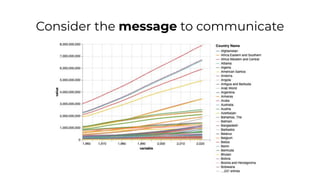
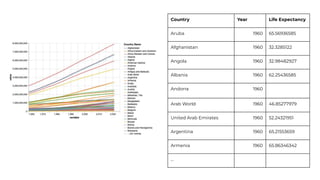
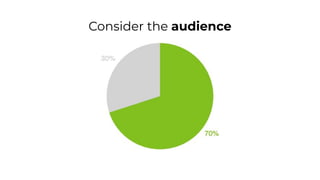
- 5. Consider the message to communicate
- 6. Country Year Life Expectancy Aruba 1960 65.56936585 Afghanistan 1960 32.3285122 Angola 1960 32.98482927 Albania 1960 62.25436585 Andorra 1960 Arab World 1960 46.85277979 United Arab Emirates 1960 52.24321951 Argentina 1960 65.21553659 Armenia 1960 65.86346342 ˇ
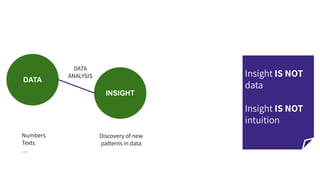
- 8. DATA INSIGHT Numbers Texts ˇ Discovery of new patterns in data DATA ANALYSIS Insight IS NOT data Insight IS NOT intuition
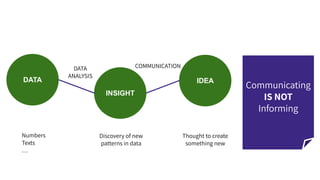
- 9. DATA INSIGHT IDEA Numbers Texts ˇ Discovery of new patterns in data DATA ANALYSIS Thought to create something new COMMUNICATION Communicating IS NOT Informing
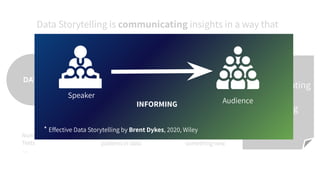
- 10. Data Storytelling is communicating insights in a way that inspires the audience to act. DATA INSIGHT IDEA Numbers Texts ˇ Discovery of new patterns in data DATA ANALYSIS Thought to create something new COMMUNICATION Communicating IS NOT Informing INFORMING * Effective Data Storytelling by Brent Dykes, 2020, Wiley Speaker Audience
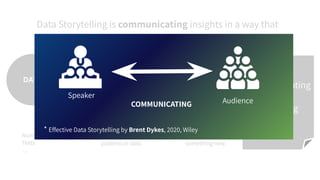
- 11. Data Storytelling is communicating insights in a way that inspires the audience to act. DATA INSIGHT IDEA Numbers Texts ˇ Discovery of new patterns in data DATA ANALYSIS Thought to create something new COMMUNICATION Communicating IS NOT Informing * Effective Data Storytelling by Brent Dykes, 2020, Wiley COMMUNICATING Speaker Audience
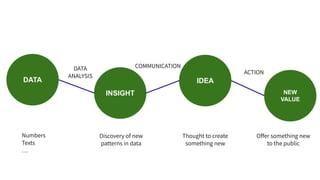
- 12. DATA INSIGHT IDEA NEW VALUE Numbers Texts ˇ Discovery of new patterns in data DATA ANALYSIS COMMUNICATION Thought to create something new ACTION Offer something new to the public
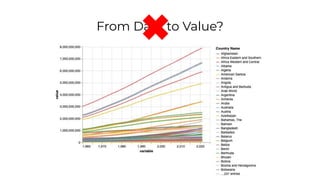
- 13. From Data to Value?
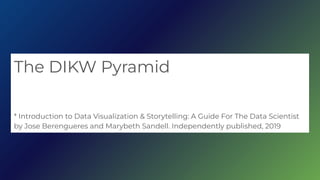
- 14. The DIKW Pyramid * Introduction to Data Visualization & Storytelling: A Guide For The Data Scientist by Jose Berengueres and Marybeth Sandell. Independently published, 2019
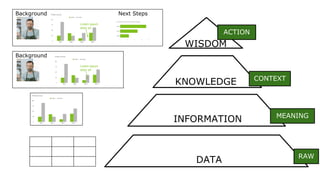
- 15. DATA INFORMATION KNOWLEDGE WISDOM RAW MEANING CONTEXT ACTION Lorem ipsum dolor sit Lorem ipsum dolor sit Background Background Next Steps
- 16. DATA INFORMATION KNOWLEDGE WISDOM RAW MEANING CONTEXT ACTION Lorem ipsum dolor sit Lorem ipsum dolor sit Background Background Next Steps
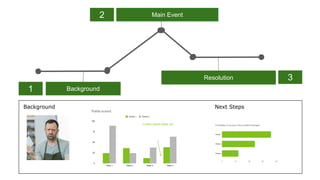
- 17. Lorem ipsum dolor sit Background Next Steps Background Main Event Resolution 1 2 3
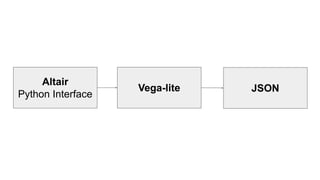
- 18. Python Altair
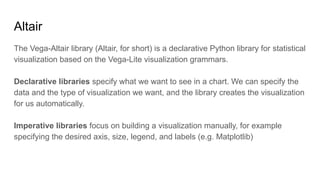
- 19. Altair The Vega-Altair library (Altair, for short) is a declarative Python library for statistical visualization based on the Vega-Lite visualization grammars. Declarative libraries specify what we want to see in a chart. We can specify the data and the type of visualization we want, and the library creates the visualization for us automatically. Imperative libraries focus on building a visualization manually, for example specifying the desired axis, size, legend, and labels (e.g. Matplotlib)
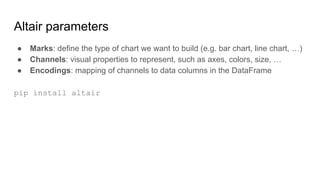
- 21. Altair parameters ˇń Marks: define the type of chart we want to build (e.g. bar chart, line chart, ˇ) ˇń Channels: visual properties to represent, such as axes, colors, size, ˇ ˇń Encodings: mapping of channels to data columns in the DataFrame pip install altair
- 22. A first example import pandas as pd import altair as alt df = pd.DataFrame({ 'value' : [3,2,4], 'category' : ['M','N','O'] }) chart = alt.Chart(df ).mark_bar( ).encode( x = 'value:Q', y = 'category:N' ) chart
- 23. Case Study
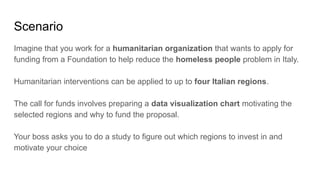
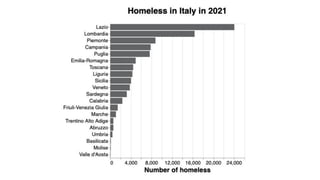
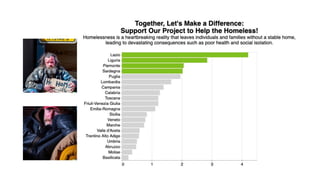
- 24. Scenario Imagine that you work for a humanitarian organization that wants to apply for funding from a Foundation to help reduce the homeless people problem in Italy. Humanitarian interventions can be applied to up to four Italian regions. The call for funds involves preparing a data visualization chart motivating the selected regions and why to fund the proposal. Your boss asks you to do a study to figure out which regions to invest in and motivate your choice
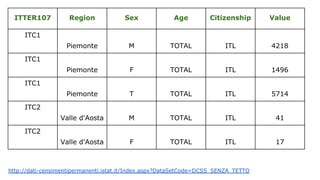
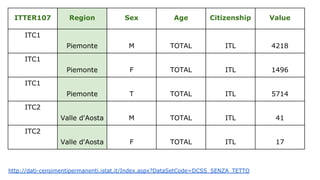
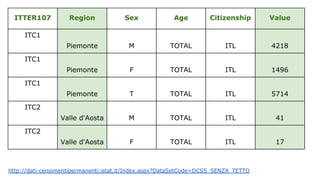
- 25. ITTER107 Region Sex Age Citizenship Value ITC1 Piemonte M TOTAL ITL 4218 ITC1 Piemonte F TOTAL ITL 1496 ITC1 Piemonte T TOTAL ITL 5714 ITC2 Valle d'Aosta M TOTAL ITL 41 ITC2 Valle d'Aosta F TOTAL ITL 17 http://dati-censimentipermanenti.istat.it/Index.aspx?DataSetCode=DCSS_SENZA_TETTO
- 26. ITTER107 Region Sex Age Citizenship Value ITC1 Piemonte M TOTAL ITL 4218 ITC1 Piemonte F TOTAL ITL 1496 ITC1 Piemonte T TOTAL ITL 5714 ITC2 Valle d'Aosta M TOTAL ITL 41 ITC2 Valle d'Aosta F TOTAL ITL 17 http://dati-censimentipermanenti.istat.it/Index.aspx?DataSetCode=DCSS_SENZA_TETTO
- 27. ITTER107 Region Sex Age Citizenship Value ITC1 Piemonte M TOTAL ITL 4218 ITC1 Piemonte F TOTAL ITL 1496 ITC1 Piemonte T TOTAL ITL 5714 ITC2 Valle d'Aosta M TOTAL ITL 41 ITC2 Valle d'Aosta F TOTAL ITL 17 http://dati-censimentipermanenti.istat.it/Index.aspx?DataSetCode=DCSS_SENZA_TETTO
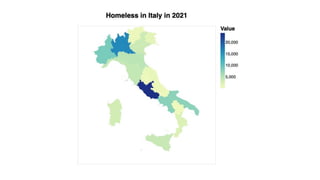
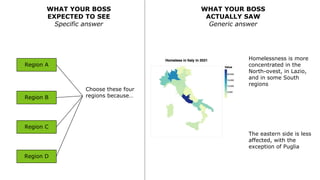
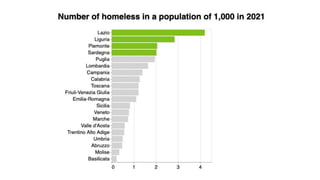
- 29. WHAT YOUR BOSS EXPECTED TO SEE Specific answer WHAT YOUR BOSS ACTUALLY SAW Generic answer Region A Region B Region C Region D Choose these four regions becauseˇ Homelessness is more concentrated in the North-ovest, in Lazio, and in some South regions The eastern side is less affected, with the exception of Puglia
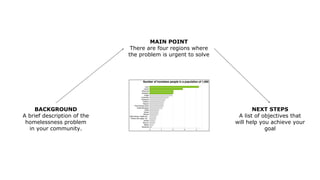
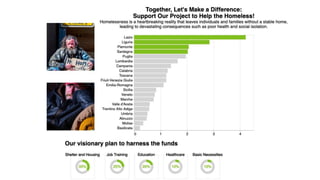
- 32. BACKGROUND A brief description of the homelessness problem in your community. NEXT STEPS A list of objectives that will help you achieve your goal MAIN POINT There are four regions where the problem is urgent to solve
- 36. Data Storytelling with Python Altair and Generative AI Discount code (35%): au35duc https://www.manning.com/boo ks/data-storytelling-with-python -altair-and-generative-ai
- 37. LetˇŻs look at the code https://github.com/alod83/Data-Storytelling-with-Python-Altair-and-Generati ve-AI/tree/main
- 38. Thanks for your Attention! https://alod83.medium.com/ https://www.linkedin.com/in/angelicaloduca/