Visual Analytics - Makingn Sense of Big Data
Download as pptx, pdf0 likes2,376 views

Visual analytics combines human cognition with machine computation to help make sense of big data through data visualization and analytics. Dr. Kai Xu's research focuses on developing visual analytic techniques, including the DIVA project which uses visual analytics and analytic provenance to help ground troops understand local social structures in human terrain analysis. The research aims to capture how users make sense of data through provenance and narrative to help with sensemaking and decision making when analyzing large, complex datasets.


Visual Analytics - Makingn Sense of Big Data
- 1. Visual Analytics: Making Sense of Big Data Dr Kai Xu Senior Lecturer in Visual Analytics Middlesex University, London
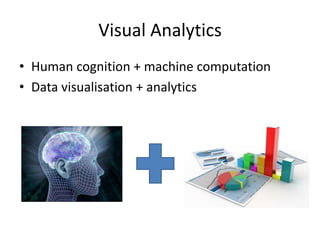
- 4. Visual Analytics âĒ Human cognition + machine computation âĒ Data visualisation + analytics
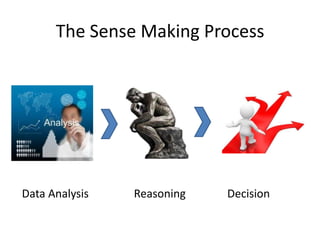
- 5. The Sense Making Process Data Analysis Reasoning Decision
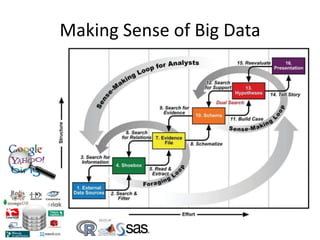
- 7. Making Sense of Big Data
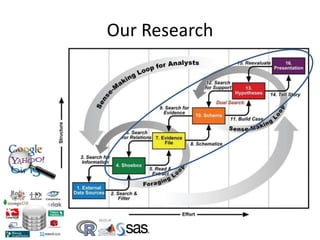
- 8. Our Research
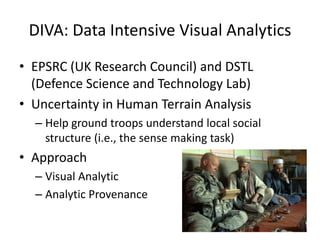
- 10. DIVA: Data Intensive Visual Analytics âĒ EPSRC (UK Research Council) and DSTL (Defence Science and Technology Lab) âĒ Uncertainty in Human Terrain Analysis â Help ground troops understand local social structure (i.e., the sense making task) âĒ Approach â Visual Analytic â Analytic Provenance
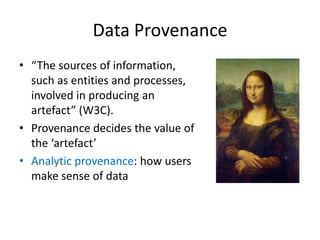
- 11. Data Provenance âĒ âThe sources of information, such as entities and processes, involved in producing an artefactâ (W3C). âĒ Provenance decides the value of the âartefactâ âĒ Analytic provenance: how users make sense of data
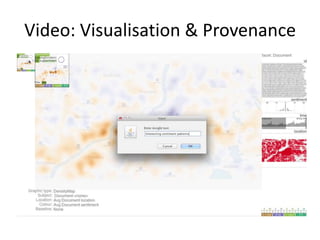
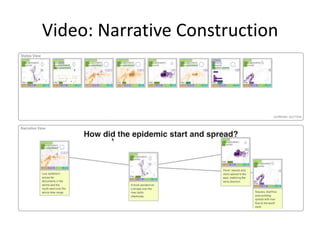
- 14. Video: Visualisation & Provenance
- 16. Looking for domain application and commercial collaboration Kai Xu k.xu@mdx.ac.uk http://kaixu.me
Editor's Notes
- #2: What is visual analytics, and how visual analytics can be used to make sense of big data. Different from data visualisationStart with some background
- #3: Middlesex University, north-west LondonIt is a young university and growing very fastLast two years hire 150 new academic staffs, from deans, professors, to lecturers.
- #4: A recent photo of staff members (not all of them), and all the students are missing.Lead the UK Visual Analytics Consortium (UKVAC): four other universities.
- #5: What is visual analytics?Humans are particularly good at certain things, such as finding patterns in the data. Machines can computer very fast and process large amount of data. Visual Analysis tries to combine the best of both worlds.
- #6: Everyone of us does sense making all the time: Start with data collection and analysisInterpret the results: what does the number tell me?Make a decision: plan of actions
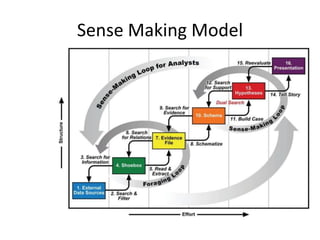
- #7: A slightly more complex model of Sense Making6 stagesIterative process
- #8: For big data, most focus on the early stages of sense makingwe have storage, search, and analysisRelatively very little on the further stages
- #9: This is the focus of our research. Not all the stages at the same time yet.Mostly in the defence and intelligence domain.
- #10: Various funding sources: EPSRC, dstl, UK Government, EUNo, we were not involved in the NSAOne example
- #12: A fake Mona Lisa does not worth muchData from unreliable sources probably should be avoided altogether
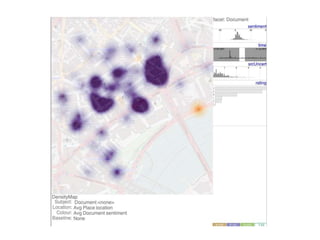
- #13: PrototypeFacets: location, time, authorView can be configuredSelect which is the main viewDynamic filtering
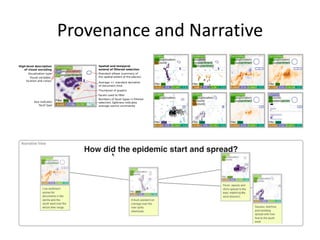
- #14: Provenance of the visualisationProvenance of the data explorationConstruct narrative
- #15: Visualise epidemic spread through twitter dataFacets and filteringProvenance and note taking
- #17: Application in domain other than defence and intelligenceCommercialisation feasiblity