Data Visualization in R
Download as pptx, pdf1 like2,108 views
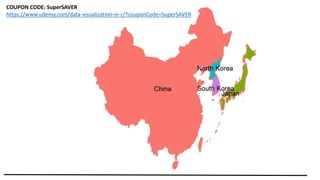
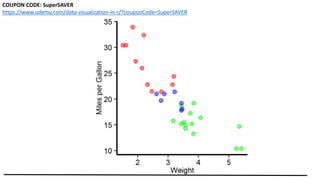
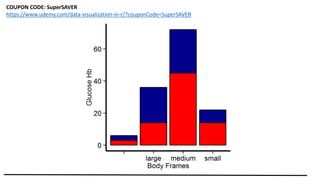
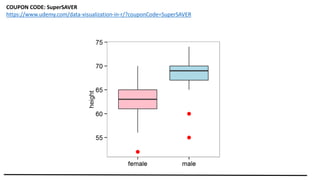
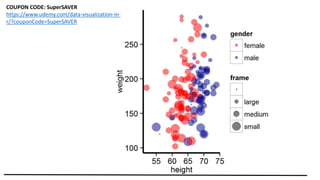
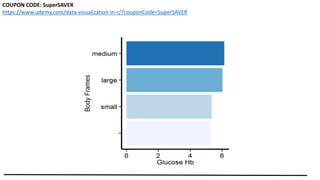
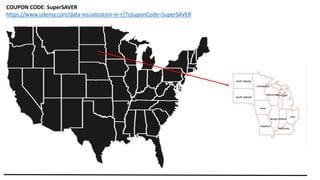
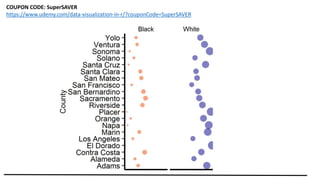
The document promotes a course on data visualization in R, available on Udemy. It emphasizes the ability to let data tell its own story. Multiple links and a coupon code 'supersaver' are provided for potential discounts.
1 of 14
Downloaded 22 times

Ad
Recommended
Data Visualization With R
Data Visualization With RRsquared Academy
?
This document outlines a course on data visualization using R, detailing objectives such as understanding data visualization concepts, building plots, and modifying visual elements. It introduces the main graphics systems in R¡ªgraphics, ggplot2, and lattice¡ªalong with practical use of the plot() function for different types of data visualization scenarios. Additionally, it covers enhancing plots by adding titles, labels, and modifying colors and ranges.R and Visualization: A match made in Heaven
R and Visualization: A match made in HeavenEdureka!
?
This document outlines an R training course on data visualization and spatial analysis. The course covers basic and advanced graphing techniques in R, including customizing graphs, color palettes, hexbin plots, tabplots, and mosaics. It also demonstrates spatial analysis examples using shapefiles and raster data to visualize and analyze geographic data in R.Introduction to R Graphics with ggplot2
Introduction to R Graphics with ggplot2izahn
?
This document outlines an introduction to R graphics using ggplot2 presented by the Harvard MIT Data Center. The presentation introduces key concepts in ggplot2 including geometric objects, aesthetic mappings, statistical transformations, scales, faceting, and themes. It uses examples from the built-in mtcars dataset to demonstrate how to create common plot types like scatter plots, box plots, and regression lines. The goal is for students to be able to recreate a sample graphic by the end of the workshop.DATA VISUALIZATION WITH R PACKAGES
DATA VISUALIZATION WITH R PACKAGESFatma ?INAR
?
The document outlines a data mining workshop held in Mu?la, Turkey, focusing on data visualization using R programming, specifically employing packages like Lattice and ggplot2. It discusses the complexities of big data and presents case studies for visualizing multidimensional datasets, including various graphs such as xyplots, histograms, and dotplots. Furthermore, it covers the Grammar of Graphics concept, allowing participants to create visually appealing and informative data representations.R-ggplot2 package Examples
R-ggplot2 package ExamplesDr. Volkan OBAN
?
This document provides various examples of using the ggplot2 package in R for data visualization, including creating dot plots, box plots, and histograms with different datasets such as student data and diamonds. It includes code snippets for visualizing data based on specific attributes, applying faceting, and modifying themes. References to additional resources and materials on ggplot2 are also included.Sparq lreference 1.8-us
Sparq lreference 1.8-usAjay Ohri
?
This document provides a reference for the SPARQL query language, including:
- An overview of SPARQL syntax for graph patterns, query forms, and result types
- Descriptions of common RDF terms, variables, operators, and value constraints that can be used in SPARQL queries
- Examples of SPARQL query syntax including SELECT, DESCRIBE, and ASK queriesData Visualization with R.ggplot2 and its extensions examples.
Data Visualization with R.ggplot2 and its extensions examples.Dr. Volkan OBAN
?
The document provides examples of data visualization in R using the ggplot2 library, including techniques for creating correlation plots and customizing themes. It also demonstrates how to simulate data and build a structural equation model (SEM) while showcasing the use of various libraries such as semplot and lavaan. Additionally, references to external resources for further learning are included.Mini Innovation Lab: Community Foundations and Shared Data
Mini Innovation Lab: Community Foundations and Shared DataBeth Kanter
?
The document summarizes a workshop on using human-centered design and data to drive innovation at community foundations. It discusses how community foundations can effectively communicate the value of shared data and become recognized knowledge connectors in their communities. The workshop utilized human-centered design techniques like engaging stakeholders, iterating solutions, and collaboration. It provided examples from the Sacramento Regional Community Foundation and Community Foundation for Greater New Haven on their use of shared data and challenges faced. The goal was for participants to leave with new ideas on improving communications and knowledge sharing through shared data.R programming Language , Rahul Singh
R programming Language , Rahul SinghRavi Basil
?
This document summarizes a seminar presentation on the R programming language. It begins with an introduction to R's history and features. Key points covered include that R is a functional programming language developed for statistical analysis. It has a large number of built-in statistical functions and packages. The document then discusses R packages, graphical user interfaces, getting started with basic objects and functions, and programming features like flow control and functions. Examples are provided. Reasons for using R include its matrix calculation, data visualization and statistical analysis capabilities. Comparisons are made to other languages like Python and Java. The document concludes that R has become a high-quality open-source software for statistical computing and graphics.Performance data visualization with r and tableau
Performance data visualization with r and tableauEnkitec
?
This document discusses using R and Tableau for performance data visualization. It provides an agenda that covers why data visualization is useful, an overview of the tools R and Tableau, how to transform raw data into visualizations, and use cases. R is an open source statistical computing language with thousands of packages for tasks like bioinformatics, spatial statistics, and financial analysis. Tableau is a fast data visualization tool that allows users to interact with and analyze data through drag and drop functionality.A Few Interesting Things in Apple's Swift Programming Language
A Few Interesting Things in Apple's Swift Programming LanguageSmartLogic
?
The document discusses several interesting features of the Swift programming language, including type inference, mutability, optionals, named parameters, enumerations, switch statements, closures, and generics. Type inference allows variable types to be inferred from values rather than explicitly declared. Optionals handle the absence of values and can be conditionally unwrapped. Closures provide block syntax similar to Objective-C but with additional optional syntax. Generics allow structures to work with different types rather than a single type.Introduction to Swift programming language.
Introduction to Swift programming language.Icalia Labs
?
This document serves as an introduction to Swift programming language, comparing it with Objective-C while covering foundational concepts such as variables, optionals, arrays, dictionaries, and control flow structures. It also delves into functions, method overriding, classes versus structures, and protocols, providing examples throughout. Additionally, it highlights some interesting facts and references relevant resources for further learning.Class ppt intro to r
Class ppt intro to rJigsawAcademy2014
?
R originated in the 1970s at Bell Labs and has since evolved significantly. It is an open-source programming language used widely for statistical analysis and graphics. While powerful, R has some drawbacks like poor performance for large datasets and a steep learning curve. However, its key advantages including being free, having a large community of users, and extensive libraries have made it a popular tool, especially for academic research.Free Download Powerpoint ºİºİߣs
Free Download Powerpoint ºİºİߣsGeorge
?
PowerPoint is a presentation tool from Microsoft that allows users to create powerful presentations with various features such as video embedding, smart user-guides, and new animations. The PowerPoint search engine enables users to search for .ppt and .pptx slides on a wide range of topics, making it a useful resource for educational and corporate presentations. It offers categories including software, mobile devices, products, and special events.Data Visualization1.pptx
Data Visualization1.pptxqwtadhsaber
?
This document discusses data visualization techniques. It begins by defining data visualization and its importance for analyzing large datasets. It then discusses the advantages of data visualization, including how visuals help people quickly understand trends and outliers. The document also covers the importance of data visualization for business decision making. It lists several benefits, such as enabling better analysis, identifying patterns, and exploring insights. Finally, it categorizes and provides examples of different types of charts for visualizing data, including charts for showing change over time, comparing categories, ranking items, part-to-whole relationships, distributions, flows, and relationships.4.Data-Visualization.pptx
4.Data-Visualization.pptxPratyushJain37
?
This document provides an overview of data visualization concepts and techniques using R. It begins with an agenda and introduces data visualization and its importance. Key concepts in data visualization like the grammar of graphics are explained. Visualization techniques using base graphics in R like bar plots and histograms are demonstrated. Visualization with ggplot2 is covered through examples using geoms like geom_bar(), geom_hist(), geom_point(), and geom_boxplot(). Faceting and theme layers are also explained. The document ends with sample quiz questions.Data Visualization in Data Science
Data Visualization in Data ScienceMaloy Manna, PMP?
?
The document discusses the importance of data visualization in data science, highlighting its role at various stages of the data science process and how it aids in understanding data and engaging audiences. It covers visual encoding techniques, biases in visualization, and the tools available for creating effective visualizations. Additionally, it outlines design principles and narrative structures essential for conveying insights through data.DATA ANALYSIS AND VISUALISATION using python 2
DATA ANALYSIS AND VISUALISATION using python 2ChiragNahata2
?
The document covers the fundamentals and advanced techniques of data analysis and visualization in Python, including the use of libraries like pandas, matplotlib, and seaborn. It explains setting up the environment, data manipulation, exploratory data analysis, and advanced topics like machine learning and interactive visualizations. The presentation aims to empower users, from beginners to advanced, to transform raw data into insightful visual stories.Introduction to Data Visualization_Day 1.pptx
Introduction to Data Visualization_Day 1.pptxkrittika26
?
The document is an introduction to data visualization, emphasizing the importance of transforming raw data into compelling visual stories that communicate insights effectively. It covers various topics, including the types of charts, tools for data storytelling, common pitfalls to avoid, and hands-on exercises with specific datasets. Key takeaways highlight the necessity of knowing the audience, defining objectives, and adhering to the golden rules of effective visualization.Introduction to Data Visualization, Importance and types
Introduction to Data Visualization, Importance and typesgrsssyw24
?
Data visualization is the process of converting data into visual formats like charts and graphs to enhance understanding and communication. It is essential for identifying patterns, making informed decisions, and facilitating effective communication across various fields. Popular tools and libraries for data visualization include Tableau, Power BI, and programming libraries like Matplotlib and ggplot2.Chapter 2: Data visualization and graphical representation- Mouna Bouzazi.pdf
Chapter 2: Data visualization and graphical representation- Mouna Bouzazi.pdfMouna Bouzazi
?
The document is a comprehensive guide on data visualization and graphical representation in R, detailing its importance, tools, and related practices. It emphasizes the role of data preparation, the capabilities of R for handling and visualizing data with packages like ggplot2 and plotly, and provides practical examples of various types of charts. Additionally, the guide discusses the benefits of using R, including flexibility, community support, and cost-effectiveness.Introduction to R Short course Fall 2016
Introduction to R Short course Fall 2016Spencer Fox
?
The document provides instructions for an introductory R session, including downloading materials from a GitHub repository and opening an R project file. It outlines logging in, downloading an R project folder containing intro materials, and opening the project file in RStudio.alltrinbruno(DS2) data science visualisation.pptx
alltrinbruno(DS2) data science visualisation.pptxrajavaishnaviit
?
The document discusses the significance of data visualization in data science, highlighting its role in transforming raw data into visual formats to enhance understanding and communication. It outlines various tools and programming languages, particularly Python, that facilitate data visualization through multiple graphing packages. The key benefits of data visualization include pattern recognition, improved data engagement, real-time monitoring, and enhanced productivity.Science Online 2013: Data Visualization Using R
Science Online 2013: Data Visualization Using RWilliam Gunn
?
This document discusses data visualization using R. It begins with a brief history of data visualization and introduces R as an open-source tool for data analysis and visualization that allows working with larger and more diverse datasets than Excel. It then covers important R concepts like data structures, loading and selecting data, and the ggplot2 package for creating graphs and visualizations by layering different geoms like points, lines, bars and boxplots.Data visualization
Data visualizationMoushmi Dasgupta
?
This document outlines an educational session focused on data visualization, covering exploratory data analysis (EDA), effective visualization fundamentals, and tools like Python, R, and Knime. It emphasizes the importance of understanding datasets, handling data quality issues, and generating actionable insights through reports and visualizations. Various data visualization libraries and their functionalities are also discussed, alongside the process of creating meaningful analytical reports.R visualization: ggplot2, googlevis, plotly, igraph Overview
R visualization: ggplot2, googlevis, plotly, igraph OverviewOlga Scrivner
?
The document provides an extensive overview of data visualization techniques in R, focusing on the use of several packages including ggplot2, googlevis, plotly, and igraph. It covers topics such as the grammar of graphics, plot creation, and interactive visualizations along with practical examples and resources for each method. Additionally, it addresses the capabilities of each package and their integration for creating effective visual representations of data.Tableau Tutorial Complete by Rohit Dubey
Tableau Tutorial Complete by Rohit Dubeykiranrajat
?
The document is a comprehensive tutorial on Tableau, a powerful data visualization and business intelligence tool suitable for users with or without programming skills. It covers various aspects of Tableau including its history, features, advantages, disadvantages, and numerous data visualization techniques using charts and graphs. The tutorial also highlights the importance of data visualization and lists several popular tools available for this purpose.More Related Content
Viewers also liked (6)
R programming Language , Rahul Singh
R programming Language , Rahul SinghRavi Basil
?
This document summarizes a seminar presentation on the R programming language. It begins with an introduction to R's history and features. Key points covered include that R is a functional programming language developed for statistical analysis. It has a large number of built-in statistical functions and packages. The document then discusses R packages, graphical user interfaces, getting started with basic objects and functions, and programming features like flow control and functions. Examples are provided. Reasons for using R include its matrix calculation, data visualization and statistical analysis capabilities. Comparisons are made to other languages like Python and Java. The document concludes that R has become a high-quality open-source software for statistical computing and graphics.Performance data visualization with r and tableau
Performance data visualization with r and tableauEnkitec
?
This document discusses using R and Tableau for performance data visualization. It provides an agenda that covers why data visualization is useful, an overview of the tools R and Tableau, how to transform raw data into visualizations, and use cases. R is an open source statistical computing language with thousands of packages for tasks like bioinformatics, spatial statistics, and financial analysis. Tableau is a fast data visualization tool that allows users to interact with and analyze data through drag and drop functionality.A Few Interesting Things in Apple's Swift Programming Language
A Few Interesting Things in Apple's Swift Programming LanguageSmartLogic
?
The document discusses several interesting features of the Swift programming language, including type inference, mutability, optionals, named parameters, enumerations, switch statements, closures, and generics. Type inference allows variable types to be inferred from values rather than explicitly declared. Optionals handle the absence of values and can be conditionally unwrapped. Closures provide block syntax similar to Objective-C but with additional optional syntax. Generics allow structures to work with different types rather than a single type.Introduction to Swift programming language.
Introduction to Swift programming language.Icalia Labs
?
This document serves as an introduction to Swift programming language, comparing it with Objective-C while covering foundational concepts such as variables, optionals, arrays, dictionaries, and control flow structures. It also delves into functions, method overriding, classes versus structures, and protocols, providing examples throughout. Additionally, it highlights some interesting facts and references relevant resources for further learning.Class ppt intro to r
Class ppt intro to rJigsawAcademy2014
?
R originated in the 1970s at Bell Labs and has since evolved significantly. It is an open-source programming language used widely for statistical analysis and graphics. While powerful, R has some drawbacks like poor performance for large datasets and a steep learning curve. However, its key advantages including being free, having a large community of users, and extensive libraries have made it a popular tool, especially for academic research.Free Download Powerpoint ºİºİߣs
Free Download Powerpoint ºİºİߣsGeorge
?
PowerPoint is a presentation tool from Microsoft that allows users to create powerful presentations with various features such as video embedding, smart user-guides, and new animations. The PowerPoint search engine enables users to search for .ppt and .pptx slides on a wide range of topics, making it a useful resource for educational and corporate presentations. It offers categories including software, mobile devices, products, and special events.Similar to Data Visualization in R (20)
Data Visualization1.pptx
Data Visualization1.pptxqwtadhsaber
?
This document discusses data visualization techniques. It begins by defining data visualization and its importance for analyzing large datasets. It then discusses the advantages of data visualization, including how visuals help people quickly understand trends and outliers. The document also covers the importance of data visualization for business decision making. It lists several benefits, such as enabling better analysis, identifying patterns, and exploring insights. Finally, it categorizes and provides examples of different types of charts for visualizing data, including charts for showing change over time, comparing categories, ranking items, part-to-whole relationships, distributions, flows, and relationships.4.Data-Visualization.pptx
4.Data-Visualization.pptxPratyushJain37
?
This document provides an overview of data visualization concepts and techniques using R. It begins with an agenda and introduces data visualization and its importance. Key concepts in data visualization like the grammar of graphics are explained. Visualization techniques using base graphics in R like bar plots and histograms are demonstrated. Visualization with ggplot2 is covered through examples using geoms like geom_bar(), geom_hist(), geom_point(), and geom_boxplot(). Faceting and theme layers are also explained. The document ends with sample quiz questions.Data Visualization in Data Science
Data Visualization in Data ScienceMaloy Manna, PMP?
?
The document discusses the importance of data visualization in data science, highlighting its role at various stages of the data science process and how it aids in understanding data and engaging audiences. It covers visual encoding techniques, biases in visualization, and the tools available for creating effective visualizations. Additionally, it outlines design principles and narrative structures essential for conveying insights through data.DATA ANALYSIS AND VISUALISATION using python 2
DATA ANALYSIS AND VISUALISATION using python 2ChiragNahata2
?
The document covers the fundamentals and advanced techniques of data analysis and visualization in Python, including the use of libraries like pandas, matplotlib, and seaborn. It explains setting up the environment, data manipulation, exploratory data analysis, and advanced topics like machine learning and interactive visualizations. The presentation aims to empower users, from beginners to advanced, to transform raw data into insightful visual stories.Introduction to Data Visualization_Day 1.pptx
Introduction to Data Visualization_Day 1.pptxkrittika26
?
The document is an introduction to data visualization, emphasizing the importance of transforming raw data into compelling visual stories that communicate insights effectively. It covers various topics, including the types of charts, tools for data storytelling, common pitfalls to avoid, and hands-on exercises with specific datasets. Key takeaways highlight the necessity of knowing the audience, defining objectives, and adhering to the golden rules of effective visualization.Introduction to Data Visualization, Importance and types
Introduction to Data Visualization, Importance and typesgrsssyw24
?
Data visualization is the process of converting data into visual formats like charts and graphs to enhance understanding and communication. It is essential for identifying patterns, making informed decisions, and facilitating effective communication across various fields. Popular tools and libraries for data visualization include Tableau, Power BI, and programming libraries like Matplotlib and ggplot2.Chapter 2: Data visualization and graphical representation- Mouna Bouzazi.pdf
Chapter 2: Data visualization and graphical representation- Mouna Bouzazi.pdfMouna Bouzazi
?
The document is a comprehensive guide on data visualization and graphical representation in R, detailing its importance, tools, and related practices. It emphasizes the role of data preparation, the capabilities of R for handling and visualizing data with packages like ggplot2 and plotly, and provides practical examples of various types of charts. Additionally, the guide discusses the benefits of using R, including flexibility, community support, and cost-effectiveness.Introduction to R Short course Fall 2016
Introduction to R Short course Fall 2016Spencer Fox
?
The document provides instructions for an introductory R session, including downloading materials from a GitHub repository and opening an R project file. It outlines logging in, downloading an R project folder containing intro materials, and opening the project file in RStudio.alltrinbruno(DS2) data science visualisation.pptx
alltrinbruno(DS2) data science visualisation.pptxrajavaishnaviit
?
The document discusses the significance of data visualization in data science, highlighting its role in transforming raw data into visual formats to enhance understanding and communication. It outlines various tools and programming languages, particularly Python, that facilitate data visualization through multiple graphing packages. The key benefits of data visualization include pattern recognition, improved data engagement, real-time monitoring, and enhanced productivity.Science Online 2013: Data Visualization Using R
Science Online 2013: Data Visualization Using RWilliam Gunn
?
This document discusses data visualization using R. It begins with a brief history of data visualization and introduces R as an open-source tool for data analysis and visualization that allows working with larger and more diverse datasets than Excel. It then covers important R concepts like data structures, loading and selecting data, and the ggplot2 package for creating graphs and visualizations by layering different geoms like points, lines, bars and boxplots.Data visualization
Data visualizationMoushmi Dasgupta
?
This document outlines an educational session focused on data visualization, covering exploratory data analysis (EDA), effective visualization fundamentals, and tools like Python, R, and Knime. It emphasizes the importance of understanding datasets, handling data quality issues, and generating actionable insights through reports and visualizations. Various data visualization libraries and their functionalities are also discussed, alongside the process of creating meaningful analytical reports.R visualization: ggplot2, googlevis, plotly, igraph Overview
R visualization: ggplot2, googlevis, plotly, igraph OverviewOlga Scrivner
?
The document provides an extensive overview of data visualization techniques in R, focusing on the use of several packages including ggplot2, googlevis, plotly, and igraph. It covers topics such as the grammar of graphics, plot creation, and interactive visualizations along with practical examples and resources for each method. Additionally, it addresses the capabilities of each package and their integration for creating effective visual representations of data.Tableau Tutorial Complete by Rohit Dubey
Tableau Tutorial Complete by Rohit Dubeykiranrajat
?
The document is a comprehensive tutorial on Tableau, a powerful data visualization and business intelligence tool suitable for users with or without programming skills. It covers various aspects of Tableau including its history, features, advantages, disadvantages, and numerous data visualization techniques using charts and graphs. The tutorial also highlights the importance of data visualization and lists several popular tools available for this purpose.From data to diagrams: an introduction to basic graphs and charts
From data to diagrams: an introduction to basic graphs and chartsSchool of Data
?
This document provides training on data visualization and transforming data into diagrams. It discusses choosing the appropriate type of visualization based on the data and questions, including pie charts to show parts of a whole, bar charts to compare categories, line graphs to show changes over time, and maps to relate data to geography. Guidelines are provided for effectively designing each type of visualization, such as limiting the number of pie chart segments and starting bar and line graphs at zero. The importance of telling a story and engaging readers is also emphasized.Data Science & AI Road Map by Python & Computer science tutor in Malaysia
Data Science & AI Road Map by Python & Computer science tutor in MalaysiaAhmed Elmalla
?
The document outlines the fundamentals of data science, emphasizing key practices such as data cleansing, analysis, visualization, and the use of Python libraries like Pandas and NumPy. It also discusses the importance of descriptive statistics and probability for data analysis, as well as tools like Tableau for creating dashboards and SQL for managing data. Additionally, it highlights real-world applications in healthcare and smart technologies, along with teaching certifications and testimonials from students.Data visualization for development
Data visualization for developmentSara-Jayne Terp
?
The document is an introductory guide to data visualization for beginners, emphasizing the importance of storytelling and asking good questions in data science. It covers the data collection process, tools for data visualization, and considerations for effective communication of results. The guide also provides resources for further learning and highlights the need for data cleaning and understanding audience context.CH 4_TYBSC(CS)_Data Science_Visualisation
CH 4_TYBSC(CS)_Data Science_Visualisationsangeeta borde
?
This document discusses data visualization and exploratory data analysis (EDA), emphasizing their importance in making data interpretation easier and uncovering relationships between variables. It outlines various techniques for univariate, bivariate, and multivariate analysis, including tools and libraries for creating visualizations, as well as key aspects of EDA like outlier detection and correlation analysis. Additionally, it reviews specific software and libraries used in data visualization, such as Tableau, Python's Matplotlib, and R's ggplot2.Ad
Recently uploaded (20)
All the DataOps, all the paradigms .
All the DataOps, all the paradigms .Lars Albertsson
?
Data warehouses, lakes, lakehouses, streams, fabrics, hubs, vaults, and meshes. We sometimes choose deliberately, sometimes influenced by trends, yet often get an organic blend. But the choices have orders of magnitude in impact on operations cost and iteration speed. Let's dissect the paradigms and their operational aspects once and for all.Lesson-3_Program-Outcomes-and-Student-Learning-Outcomes_For-Students.pdf
Lesson-3_Program-Outcomes-and-Student-Learning-Outcomes_For-Students.pdfSarahMaeDuallo
?
tendency and variability. Data visualization techniques.×îĞ°æÃÀ¹ú¼ÓÀû¸£ÄáÑÇ´óѧ¾É½ğɽ·¨Ñ§Ôº±ÏÒµÖ¤£¨±«°ä³¢²¹·É³§¹ó±ÏÒµÖ¤Ê飩¶¨ÖÆ
×îĞ°æÃÀ¹ú¼ÓÀû¸£ÄáÑÇ´óѧ¾É½ğɽ·¨Ñ§Ôº±ÏÒµÖ¤£¨±«°ä³¢²¹·É³§¹ó±ÏÒµÖ¤Ê飩¶¨ÖÆtaqyea
?
Ò»±ÈÒ»»¹Ô¼ÓÀû¸£ÄáÑÇ´óѧ¾É½ğɽ·¨Ñ§Ôº±ÏÒµÖ¤/UCLawSF±ÏÒµÖ¤Êé2025԰桾qޱ1954292140¡¿ÎÒÃÇרҵ°ìÀí°ÄÖŞ´óѧ±ÏÒµÖ¤³É¼¨µ¥£¬ÃÀ¹ú´óѧ±ÏÒµÖ¤³É¼¨µ¥,Ó¢¹ú´óѧ±ÏÒµÖ¤³É¼¨µ¥£¬¼ÓÄôó´óѧ±ÏÒµÖ¤³É¼¨µ¥£¬Ğ¼ÓÆ´óѧ±ÏÒµÖ¤³É¼¨µ¥£¬ĞÂÎ÷À¼´óѧ±ÏÒµÖ¤³É¼¨µ¥£¬º«¹ú´óѧ±ÏÒµÖ¤³É¼¨µ¥£¬ÈÕ±¾´óѧ±ÏÒµÖ¤³É¼¨µ¥¡£
¡¾¸´¿ÌÒ»Ì×¼ÓÀû¸£ÄáÑÇ´óѧ¾É½ğɽ·¨Ñ§Ôº±ÏÒµÖ¤³É¼¨µ¥ĞÅ·âµÈ²ÄÁÏ×îÇ¿¹¥ÂÔ,Buy University of California College of the Law, San Francisco Transcripts¡¿
¹ºÂòÈÕº«³É¼¨µ¥¡¢Ó¢¹ú´óѧ³É¼¨µ¥¡¢ÃÀ¹ú´óѧ³É¼¨µ¥¡¢°ÄÖŞ´óѧ³É¼¨µ¥¡¢¼ÓÄôó´óѧ³É¼¨µ¥£¨q΢1954292140£©Ğ¼ÓÆ´óѧ³É¼¨µ¥¡¢ĞÂÎ÷À¼´óѧ³É¼¨µ¥¡¢°®¶ûÀ¼³É¼¨µ¥¡¢Î÷°àÑÀ³É¼¨µ¥¡¢µÂ¹ú³É¼¨µ¥¡£³É¼¨µ¥µÄÒâÒåÖ÷ÒªÌåÏÖÔÚÖ¤Ã÷ѧϰÄÜÁ¦¡¢ÆÀ¹ÀѧÊõ±³¾°¡¢Õ¹Ê¾×ÛºÏËØÖÊ¡¢Ìá¸ß¼ȡÂÊ£¬ÒÔ¼°ÊÇ×÷ΪÁôĞÅÈÏÖ¤ÉêÇë²ÄÁϵÄÒ»²¿·Ö¡£
¼ÓÀû¸£ÄáÑÇ´óѧ¾É½ğɽ·¨Ñ§Ôº³É¼¨µ¥Äܹ»ÌåÏÖÄúµÄµÄѧϰÄÜÁ¦£¬°üÀ¨¼ÓÀû¸£ÄáÑÇ´óѧ¾É½ğɽ·¨Ñ§Ôº¿Î³Ì³É¼¨¡¢×¨ÒµÄÜÁ¦¡¢Ñо¿ÄÜÁ¦¡££¨q΢1954292140£©¾ßÌåÀ´Ëµ£¬³É¼¨±¨¸æµ¥Í¨³£°üº¬Ñ§ÉúµÄѧϰ¼¼ÄÜÓëÏ°¹ß¡¢¸÷¿Æ³É¼¨ÒÔ¼°ÀÏʦÆÀÓïµÈ²¿·Ö£¬Òò´Ë£¬³É¼¨µ¥²»½öÊÇѧÉúѧÊõÄÜÁ¦µÄÖ¤Ã÷£¬Ò²ÊÇÆÀ¹ÀѧÉúÊÇ·ñÊʺÏij¸ö½ÌÓıÏîÄ¿µÄÖØÒªÒÀ¾İ£¡
ÎÒÃdzĞŵ²ÉÓõÄÊÇѧУ԰æÖ½ÕÅ£¨Ô°æÖ½ÖÊ¡¢µ×É«¡¢ÎÆ·£©ÎÒÃǹ¤³§ÓµÓĞÈ«Ì×½ø¿ÚÔ×°É豸£¬ÌØÊ⹤ÒÕ¶¼ÊDzÉÓò»Í¬»úÆ÷ÖÆ×÷£¬·ÂÕæ¶È»ù±¾¿ÉÒÔ´ïµ½100%£¬ËùÓгÉÆ·ÒÔ¼°¹¤ÒÕЧ¹û¶¼¿ÉÌáÇ°¸ø¿Í»§Õ¹Ê¾£¬²»ÂúÒâ¿ÉÒÔ¸ù¾İ¿Í»§ÒªÇó½øĞе÷Õû£¬Ö±µ½ÂúÒâΪֹ£¡
¡¾Ö÷ÓªÏîÄ¿¡¿
Ò»¡¢¹¤×÷δȷ¶¨£¬»Ø¹úĞèÏȸø¸¸Ä¸¡¢Ç×ÆİÅóÓÑ¿´ÏÂÎÄƾµÄÇé¿ö£¬°ìÀí±ÏÒµÖ¤|°ìÀíÎÄƾ: Âò´óѧ±ÏÒµÖ¤|Âò´óѧÎÄƾ¡¾qޱ1954292140¡¿¼ÓÀû¸£ÄáÑÇ´óѧ¾É½ğɽ·¨Ñ§ÔºÑ§Î»Ö¤Ã÷ÊéÈçºÎ°ìÀíÉêÇ룿
¶ş¡¢»Ø¹ú½ø˽Æó¡¢ÍâÆó¡¢×Ô¼º×öÉúÒâµÄÇé¿ö£¬ÕâĞ©µ¥Î»ÊDz»²éѯ±ÏÒµÖ¤ÕæαµÄ£¬¶øÇÒ¹úÄÚûÓĞÇşµÀÈ¥²éѯ¹úÍâÎÄƾµÄÕæ¼Ù£¬Ò²²»ĞèÒªÌṩÕæʵ½ÌÓı²¿ÈÏÖ¤¡£¼øÓÚ´Ë£¬°ìÀíÃÀ¹ú³É¼¨µ¥¼ÓÀû¸£ÄáÑÇ´óѧ¾É½ğɽ·¨Ñ§Ôº±ÏÒµÖ¤¡¾qޱ1954292140¡¿¹úÍâ´óѧ±ÏÒµÖ¤, ÎÄƾ°ìÀí, ¹úÍâÎÄƾ°ìÀí, ÁôĞÅÍøÈÏÖ¤
Èı.²ÄÁÏ×Éѯ°ìÀí¡¢ÈÏÖ¤×Éѯ°ìÀíÇë¼ÓѧÀú¹ËÎÊ¡¾Î¢ĞÅ:1954292140¡¿¼ÓÀû¸£ÄáÑÇ´óѧ¾É½ğɽ·¨Ñ§Ôº±ÏÒµÖ¤¹ºÂòÖ¸´óѧÎÄƾ¹ºÂò£¬±ÏÒµÖ¤°ìÀíºÍÎÄƾ°ìÀí¡£Ñ§ÔºÎÄƾ¶¨ÖÆ£¬Ñ§Ğ£Ô°æÎÄƾ²¹°ì£¬É¨Ãè¼şÎÄƾ¶¨×ö£¬100%ÎÄƾ¸´¿Ì¡£Data Visualisation in data science for students
Data Visualisation in data science for studentsconfidenceascend
?
Data visualisation is explained in a simple manner.Measurecamp Copenhagen - Consent Context
Measurecamp Copenhagen - Consent ContextHuman37
?
Measurecamp Copenhagen 2025 presentation by Glenn Vanderlinden, Human37Shifting Focus on AI: How it Can Make a Positive Difference
Shifting Focus on AI: How it Can Make a Positive Difference1508 A/S
?
This morgenbooster will share how to find the positive impact of AI and how to integrate it into your own digital process. Ó¢¹ú±ÏÒµÖ¤·¶±¾ÀûÎïÆÖÔ¼º²Ä¦¶û˹´óѧ³É¼¨µ¥µ×ÎÆ·Àα³¢´³²Ñ±«Ñ§ÉúÖ¤°ìÀíѧÀúÈÏÖ¤
Ó¢¹ú±ÏÒµÖ¤·¶±¾ÀûÎïÆÖÔ¼º²Ä¦¶û˹´óѧ³É¼¨µ¥µ×ÎÆ·Àα³¢´³²Ñ±«Ñ§ÉúÖ¤°ìÀíѧÀúÈÏÖ¤ taqyed
?
LJMUÀûÎïÆÖÔ¼º²Ä¦¶û˹´óѧ±ÏÒµÖ¤Êé¶àÉÙÇ®¡¾qޱ1954292140¡¿1:1Ô°æÀûÎïÆÖÔ¼º²Ä¦¶û˹´óѧ±ÏÒµÖ¤+LJMU³É¼¨µ¥¡¾qޱ1954292140¡¿ÍêÃÀ»¹Ôº£Íâ¸÷´óѧ±ÏÒµ²ÄÁÏÉϵŤÒÕ£ºË®Ó¡£¬ÒõÓ°µ×ÎÆ£¬¸ÖÓ¡LOGOÌ̽ğÌÌÒø£¬LOGOÌ̽ğÌÌÒø¸´ºÏÖصş¡£ÎÄ×Öͼ°¸¸¡µñ¡¢¼¤¹âÀØÉä¡¢×ÏÍâÓ«¹â¡¢Î¸С¢¸´Ó¡·ÀαµÈ·Àα¹¤ÒÕ¡£
¡¾Ö÷ÓªÏîÄ¿¡¿
Ò»¡¢¹¤×÷δȷ¶¨£¬»Ø¹úĞèÏȸø¸¸Ä¸¡¢Ç×ÆİÅóÓÑ¿´ÏÂÎÄƾµÄÇé¿ö£¬°ìÀí±ÏÒµÖ¤|°ìÀíÎÄƾ: Âò´óѧ±ÏÒµÖ¤|Âò´óѧÎÄƾ¡¾qޱ1954292140¡¿Ñ§Î»Ö¤Ã÷ÊéÈçºÎ°ìÀíÉêÇ룿
¶ş¡¢»Ø¹ú½ø˽Æó¡¢ÍâÆó¡¢×Ô¼º×öÉúÒâµÄÇé¿ö£¬ÕâĞ©µ¥Î»ÊDz»²éѯ±ÏÒµÖ¤ÕæαµÄ£¬¶øÇÒ¹úÄÚûÓĞÇşµÀÈ¥²éѯ¹úÍâÎÄƾµÄÕæ¼Ù£¬Ò²²»ĞèÒªÌṩÕæʵ½ÌÓı²¿ÈÏÖ¤¡£¼øÓÚ´Ë£¬°ìÀíÀûÎïÆÖÔ¼º²Ä¦¶û˹´óѧ±ÏÒµÖ¤|LJMU³É¼¨µ¥¡¾qޱ1954292140¡¿¹úÍâ´óѧ±ÏÒµÖ¤, ÎÄƾ°ìÀí, ¹úÍâÎÄƾ°ìÀí, ÁôĞÅÍøÈÏÖ¤
Èı.²ÄÁÏ×Éѯ°ìÀí¡¢ÈÏÖ¤×Éѯ°ìÀíÇë¼ÓѧÀú¹ËÎÊ¡¾Î¢ĞÅ:1954292140¡¿±ÏÒµÖ¤¹ºÂòÖ¸´óѧÎÄƾ¹ºÂò£¬±ÏÒµÖ¤°ìÀíºÍÎÄƾ°ìÀí¡£Ñ§ÔºÎÄƾ¶¨ÖÆ£¬Ñ§Ğ£Ô°æÎÄƾ²¹°ì£¬É¨Ãè¼şÎÄƾ¶¨×ö£¬100%ÎÄƾ¸´¿Ì¡£Starbucks in the Indian market through its joint venture.
Starbucks in the Indian market through its joint venture.sales480687
?
This topic focuses on the growth and challenges of Starbucks in the Indian market through its joint venture with Tata. It covers localization strategies, menu adaptations, expansion goals, and financial performance. The topic also examines consumer perceptions, market competition, and how Starbucks navigates economic and cultural factors in one of its most promising international markets.Boost Business Efficiency with Professional Data Entry Services
Boost Business Efficiency with Professional Data Entry Serviceseloiacs eloiacs
?
Boost Business Efficiency with Professional Data Entry Services
In today¡¯s digital-first world, businesses generate and handle massive amounts of data every day ¡ª customer records, sales data, inventory logs, survey results, and much more. But raw data has no value unless it is well-organized, accurate, and easily accessible. That¡¯s where professional data entry services come in.
By outsourcing data entry tasks to experts, businesses can streamline operations, reduce manual errors, and improve overall efficiency ¡ª while focusing their internal resources on core activities like growth and customer engagement.
What Are Data Entry Services?
Data entry services refer to the process of converting information from various formats (handwritten, scanned, PDF, image, or audio) into structured, digital formats such as Excel sheets, CRM databases, or cloud storage systems. This work may be done online or offline, manually or using automation tools, depending on the client¡¯s requirements.
Popular Data Entry Services Include:
Manual data entry from paper documents or scanned files
Online data entry directly into websites, forms, or portals
Offline data entry in formats like MS Word, Excel, or custom software
Product data entry for eCommerce platforms like Shopify, Amazon, and Flipkart
Document and image conversion into editable formats
Data cleansing and validation to remove duplicates and fix errors
Remote data entry support for real-time operations
CRM and ERP data management
These services are essential for organizing business data and making it usable for analysis, reporting, and decision-making.
Who Can Benefit from Data Entry Services?
Outsourcing data entry is not limited to any one industry ¡ª it's a universal need for businesses of all types and sizes. Here are some examples:
eCommerce Businesses ¨C For managing product catalogs, inventory updates, pricing, and customer orders.
Healthcare Providers ¨C For digitizing patient records, prescriptions, and insurance documents.
Education Institutes ¨C To maintain student records, exam results, and staff data.
Financial Services ¨C For processing invoices, bank statements, transaction records.
Real Estate Companies ¨C To handle property listings, legal paperwork, client records.
Research & Marketing Firms ¨C To compile survey data, leads, and analytics reports.
Even startups and freelancers often require virtual data entry services to stay organized and competitive.
Top Benefits of Outsourcing Data Entry Services
Outsourcing data entry work to a professional company or virtual assistant offers multiple benefits ¡ª whether you're running a small business or managing a large enterprise.
1. Reduced Costs
Maintaining an in-house data entry team means salaries, hardware, training, and software expenses. Outsourcing eliminates these costs and provides flexible, pay-as-you-go solutions.
Ad
Data Visualization in R
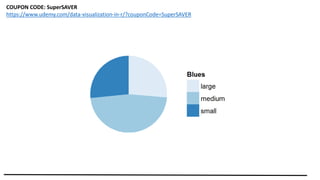
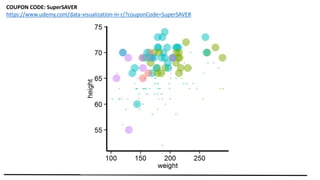
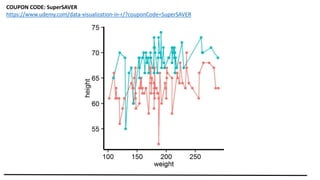
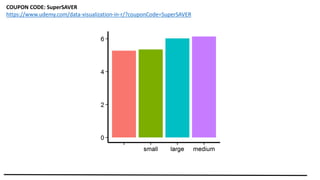
- 1. Data Visualization in R Let your data tell the story Take the full course at udemy.com COUPON CODE: SuperSAVER https://www.udemy.com/data-visualization-in-r/?couponCode=SuperSAVER
- 14. Data Visualization in R Let your data tell the story